INTRODUCTION: STRONG INVESTMENT PERFORMANCE
Over the past several years, institutional investor interest in purpose-built U.S. life sciences real estate has grown rapidly.1 Several significant secular demand factors, as well as the COVID-19 pandemic, have led to historically high public and private capital funding levels for life sciences industries. Given the extraordinary demand from the high-growth biotechnology and corporate biopharma industries, life sciences property investments have outperformed over the past ten years
(Figure 1).
After record years in 2020 and 2021, U.S. life sciences sector performance moderated in 2022 and into 2023. This slowdown is largely related to a wave of new supply in a few markets. Nevertheless, occupier requirements for lab/research & development (R&D) space remain well above pre-pandemic levels. Furthermore, the current demand outlook is stable for the years ahead with new innovation and products driving industry expansion.2 Clarion Partners believes the long-term outlook remains bright for this alternative property type sector.
FIGURE 1: NPI PLUS INVESTMENT PERFORMANCE: 3-YEAR VS. 10-YEAR TOTAL RETURN HISTORY
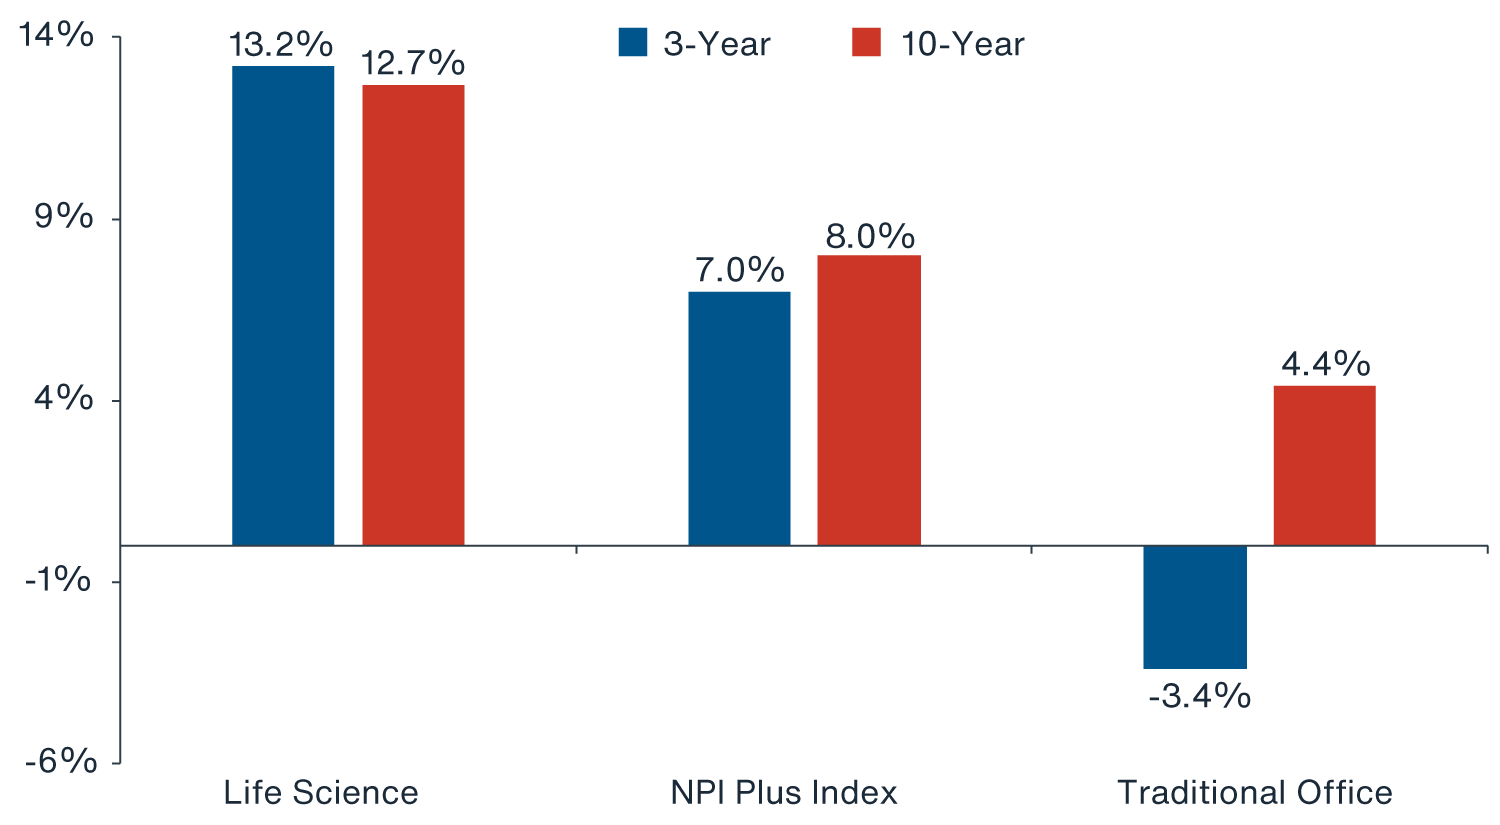
Source:
NCREIF, Clarion Partners Investment Research, Q2 2023.3
CURRENT PROPERTY-LEVEL FUNDAMENTALS & FORECAST
Supply & Demand
Over the past five years, U.S. life sciences property fundamentals have remained relatively healthy. As tenant demand soared, inventory nearly doubled.4 “Clustering” continues to be a dominant theme in life sciences due to the intrinsic benefits of the locational convergence of large hospitals, leading universities, research institutions, life sciences and biotechnology companies, highly educated workforces, and capital funding.
Tier 1 life sciences clusters − Boston/Cambridge, South San Francisco, and San Diego, are the most established clusters with the largest inventories of highly specialized purpose-built lab and R&D facilities; however, data providers now routinely track purpose-built inventory over multiple markets (e.g. CBRE tracks 13) (Figure 2).
FIGURE 2: TIER 1 LIFE SCIENCE CLUSTERS
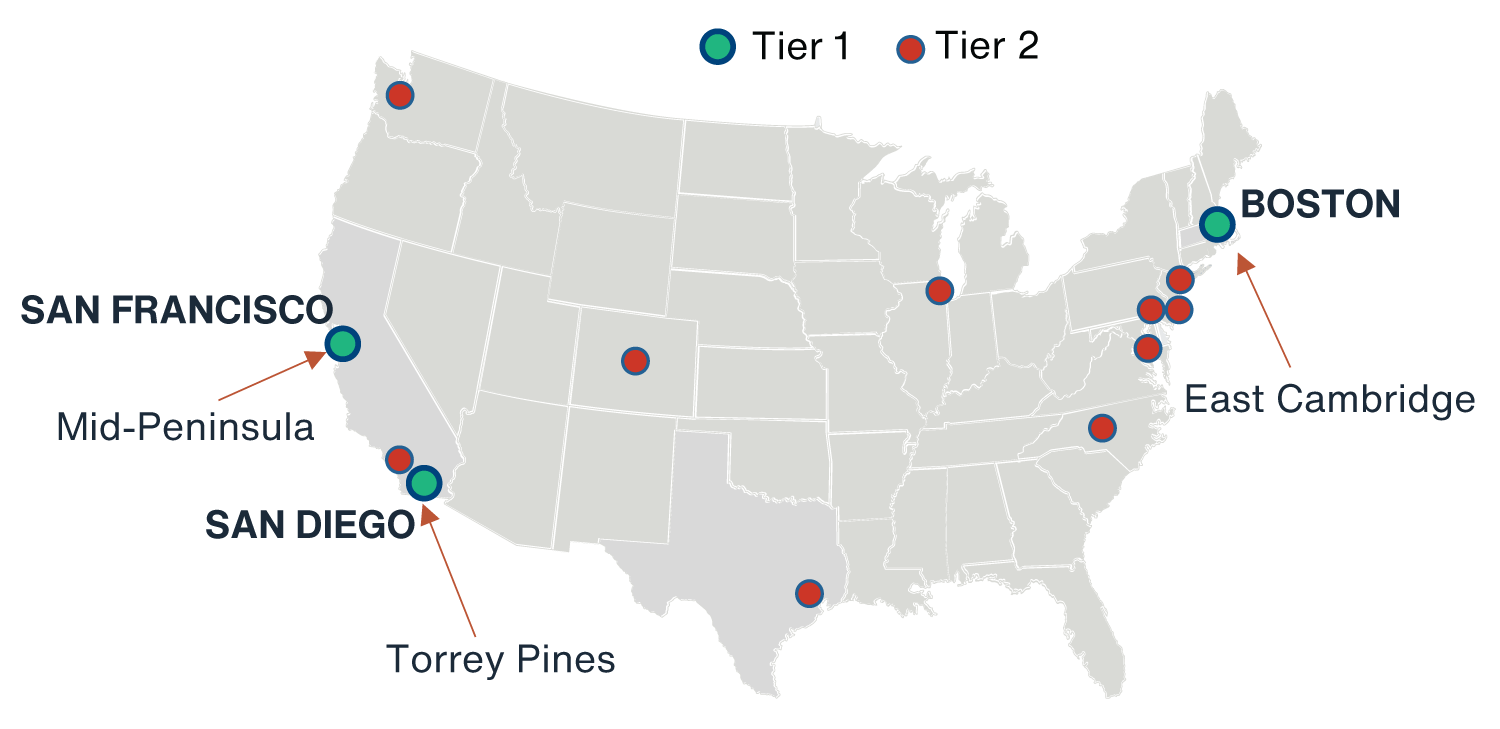
Source: CBRE, JLL, Clarion Partners Investment Research, Q3 2023. Notes: Tier 1 includes Boston/Cambridge, San Francisco, and San Diego; Tier 2 includes Raleigh-Durham, Philadelphia, New Jersey, Maryland/DC, Seattle, Los Angeles, New York City, Chicago, Denver, and Houston.
Supply & Demand
-
Rents At a Record High, Well Above Traditional Office. Over recent years, the U.S. life science average asking rent rapidly climbed to all-time highs. Tier 1 markets now command a significant rent premium over the national lab average and traditional office
(Figure 3).5
-
Historically High Absorption Over 2021-2022. Over these two years, total net absorption reached over 12.5 million square feet (MSF), a record high for two consecutive years.6 The corporate biopharma, life sciences, and biotech industries remain key drivers of growth nationwide.
-
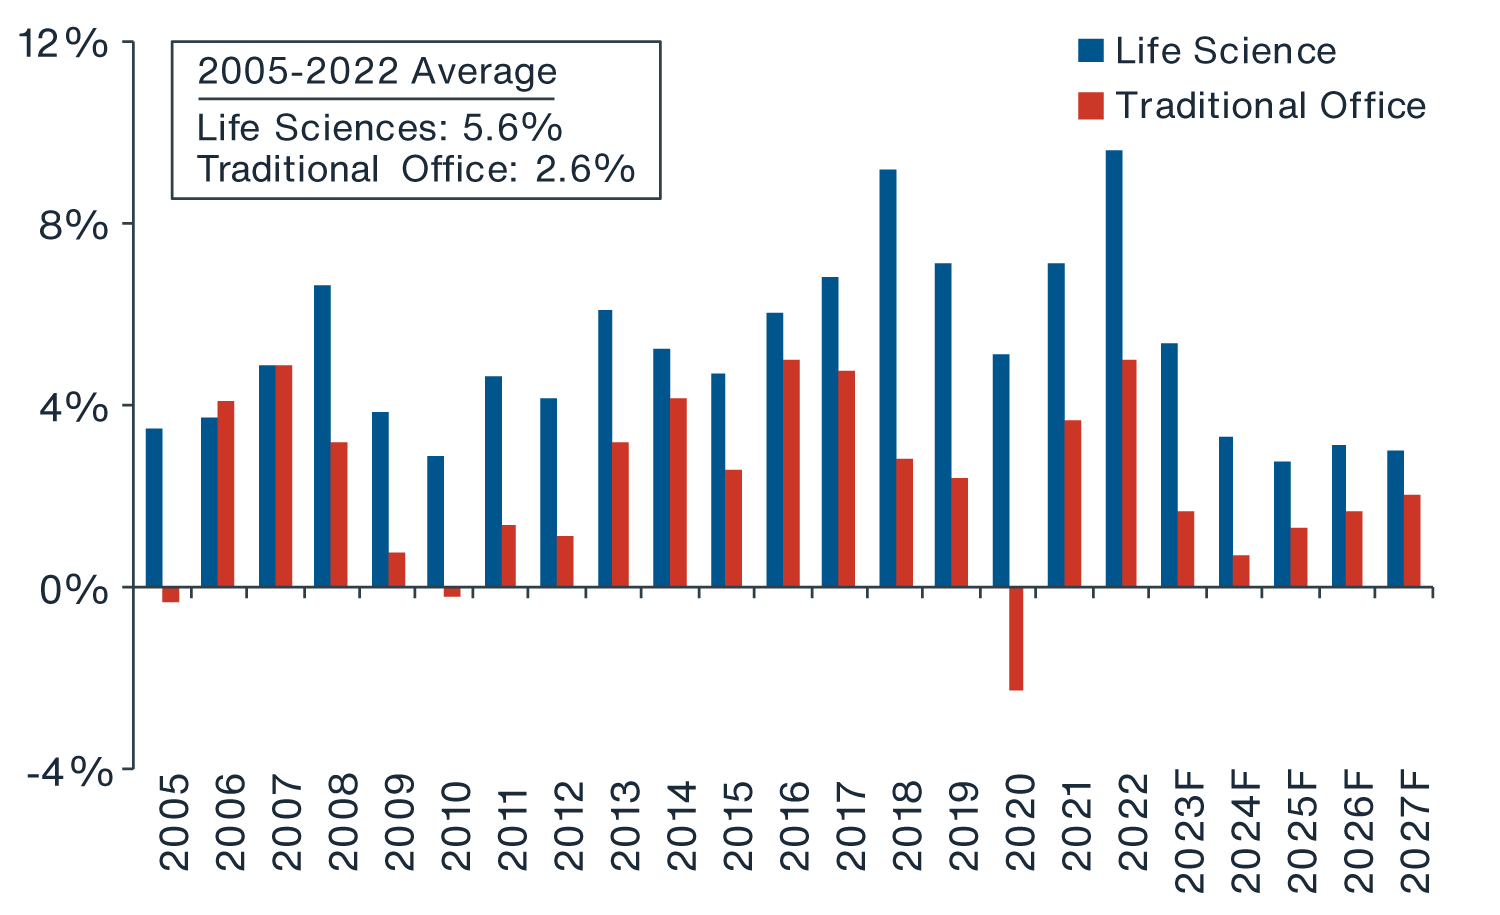
Tier 1 Markets Report Outperforming Rent Growth. At the same time, a flight to quality continues within the sector. Most Class A assets in supply-constrained areas have reported competitive rent growth on a relative basis. Over the past five years, Tier 1 average asking rent growth was well above traditional office and the three other core property types.7
-
Top Clusters Still Report Low Vacancy. In 1H 2022, the average vacancy rate across all U.S. life science markets fell to an all-time low of 5.0%; it was even lower in the Tier 1 clusters at 3.6%.8 Year-to-date in 2023, the national vacancy rate has risen to 9.1% amidst an increase in supply in many markets; however all Tier 1 markets, along with Maryland/D.C., Seattle, Denver, and New Jersey, still report vacancy levels near record-low levels
(Figure 4).9
-
Strong Tenant Requirements. As of 1H 2023, tenant demand has remained very strong at 13.2 MSF, although this is a moderation from the 20 to 30 MSF estimated for 1H 2022. According to CBRE, there are still about 350 tenants actively seeking space.10
-
Pre-Leasing Rate High in Tier 1 Markets. Within Tier 1 markets, the weighted average pre-leasing rate based on net expansions is 68%, underscoring that there continues to be organic demand growth to help absorb new supply in these markets.11
-
MedTech & Good Manufacturing Practice (GMP) Facilities Driving New Space Demand. In addition to the R&D of new therapeutics, the life sciences industry also includes medical devices and technologies and drug production, both of which have been key drivers of growth. Drug manufacturing employment and health care device and supplies’ venture capital (VC) funding have been highest in the Greater Boston area, Minneapolis-St. Paul, SF Bay Area, Orange County, and Salt Lake City.12
FIGURE 3: LIFE SCIENCES AVERAGE ASKING RENT ($/SF)
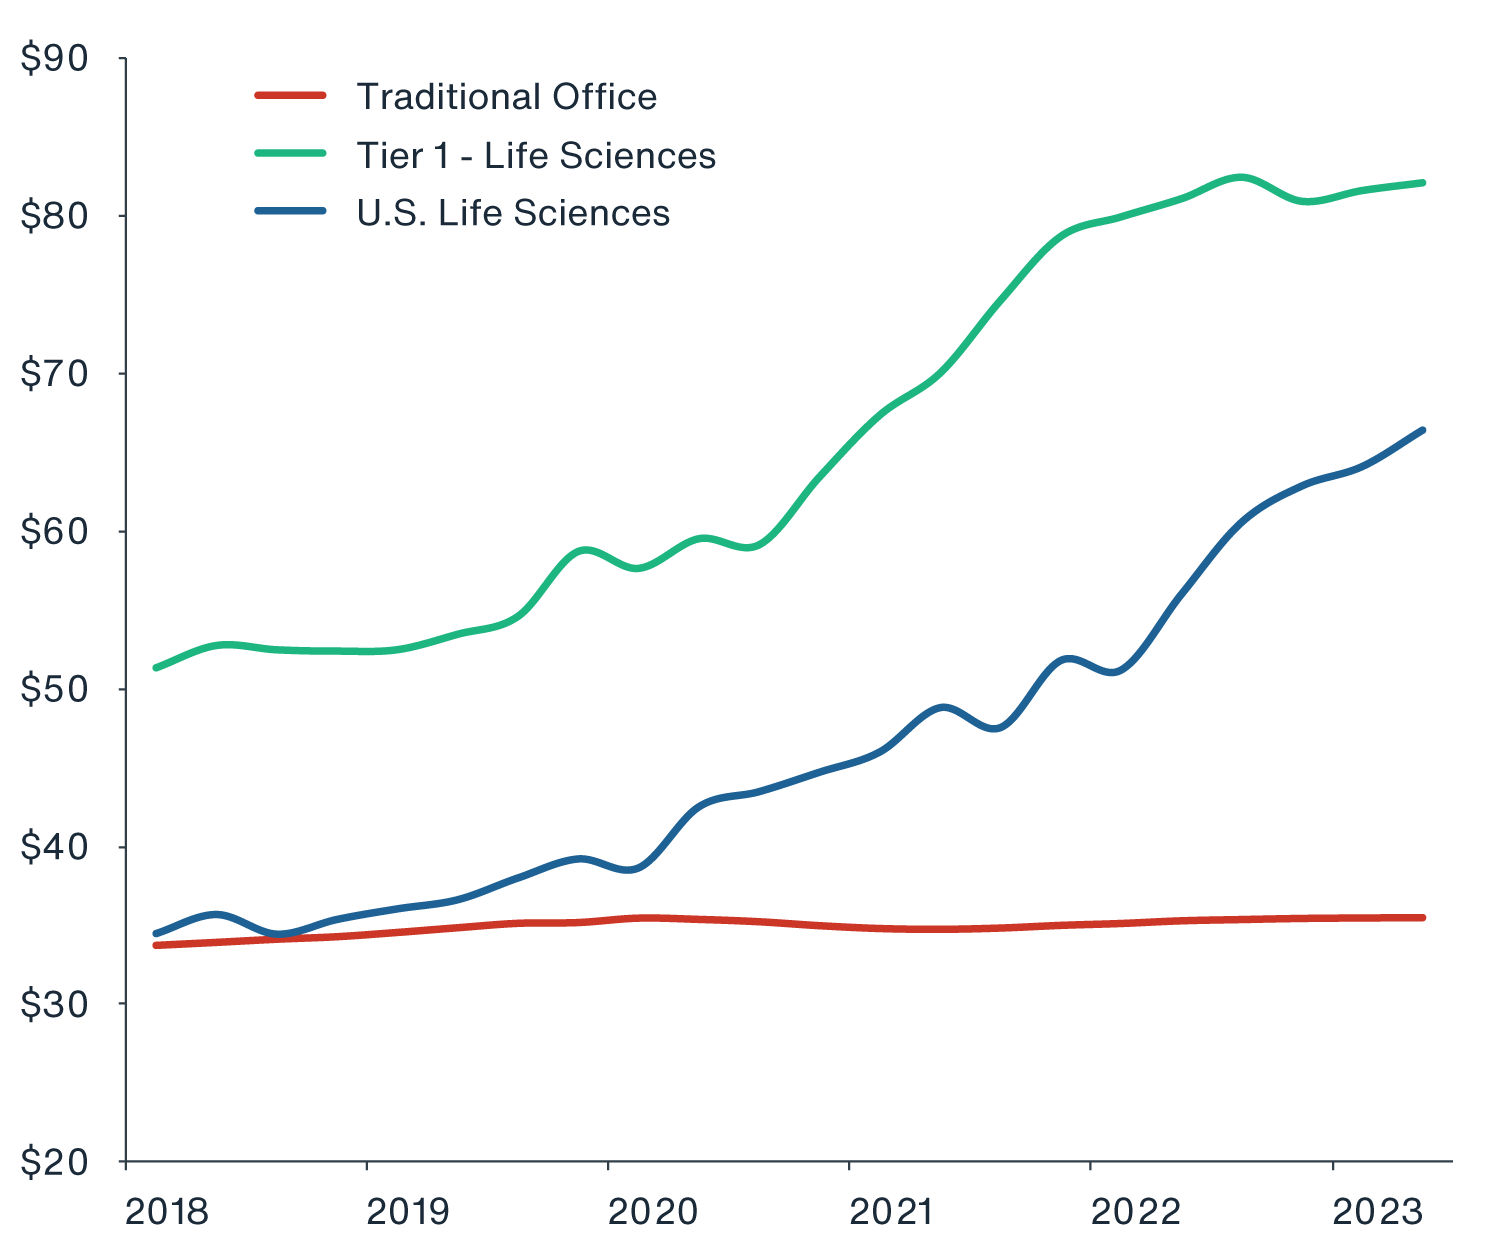
FIGURE 4: U.S. LIFE SCIENCE VS. TRADITIONAL OFFICE VACANCY RATE
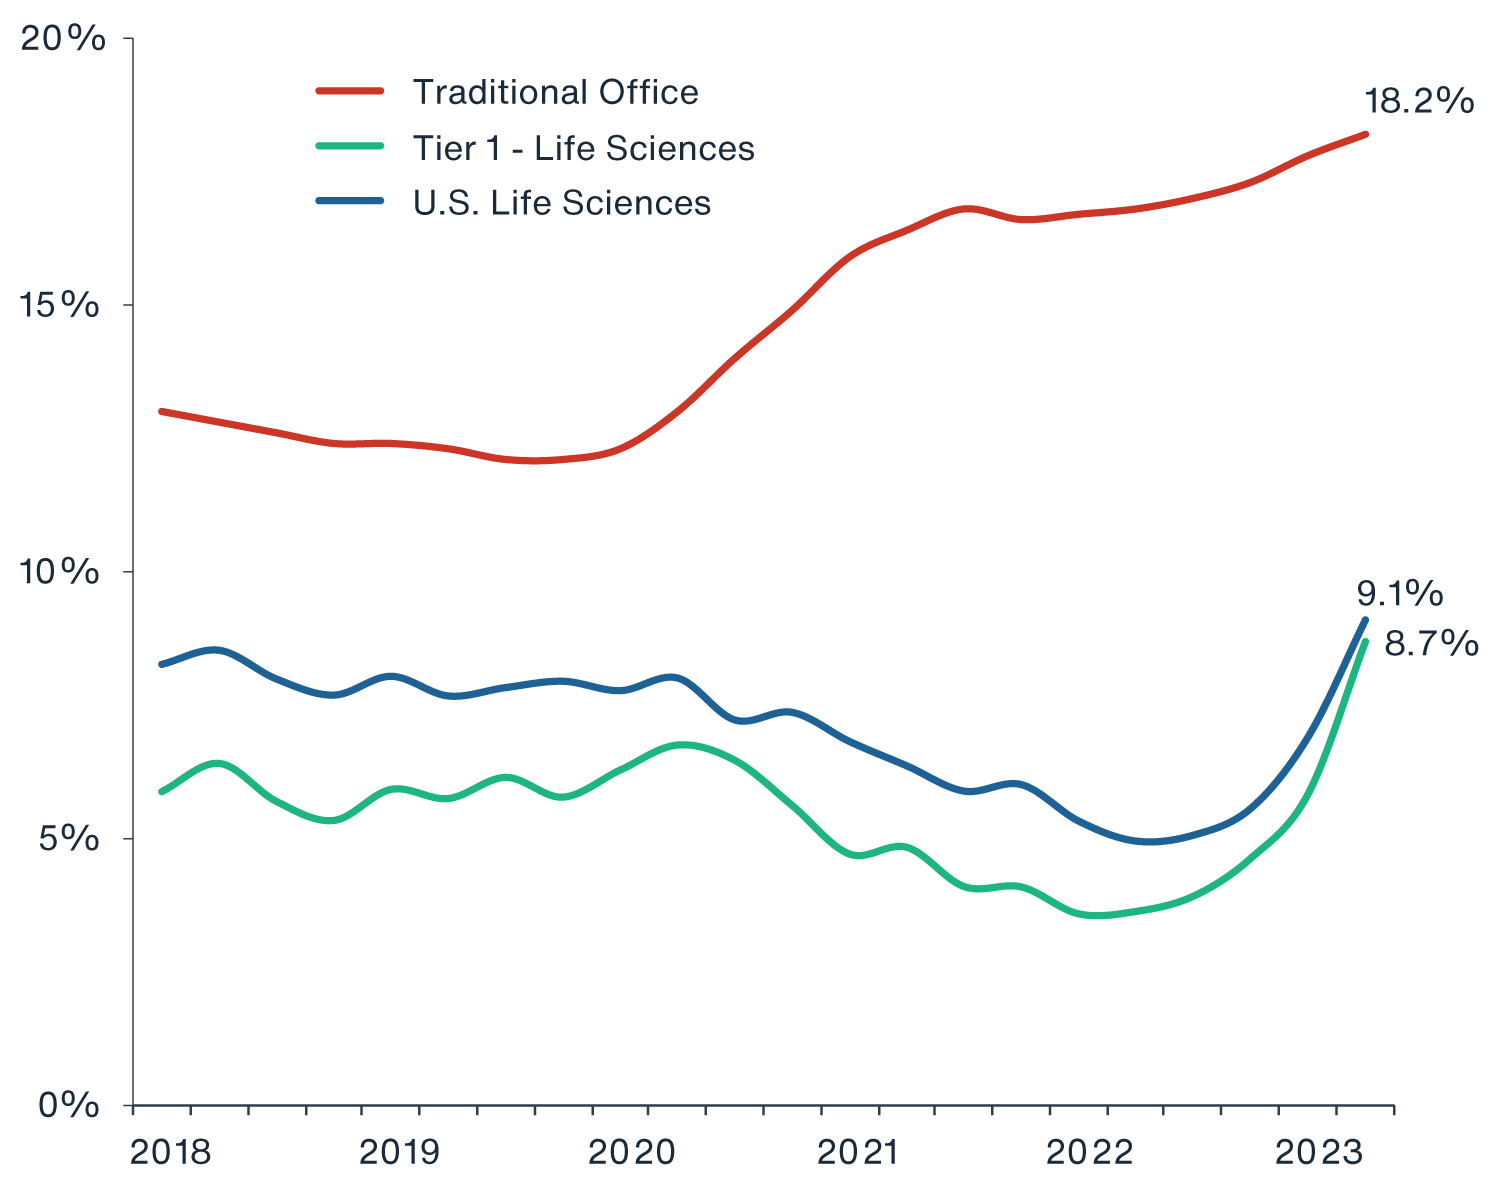
Source: CBRE, CBRE-EA, Q2 2023. Notes: 1) Tier 1 markets include Boston/Cambridge, San Francisco, & San Diego. 2) U.S. average asking rent is NNN and vacancy based on CBRE data. 3) Data as of Q2.
Forecast
Amidst the healthcare economy boom, there has been a sharp rise in lab/R&D space. This inventory now totals nearly 195 MSF, equivalent in size to 5% of total U.S. office stock.13
There is an additional 47 MSF of new life sciences space underway, much of which is concentrated in the Tier 1 markets where there is the strongest ongoing demand. This year (2023) marks the forecasted peak in new supply across Tier 1 markets. As such, we expect vacancy to continue to rise in the near term, peak in late 2023/early 2024, and then reverse trend with absorption exceeding new supply from 2024 to 2026
(Figure 5). Year-to-date, new life sciences starts and office to life science conversions have moderated significantly amidst higher financing costs, more muted job growth, elevated construction costs, and lender constraints. Our forecast shows a steady balance between supply and demand over the next five years.
FIGURE 5: TIER 1 LIFE SCIENCES SUBMARKETS: NET ABSORPTION, NEW SUPPLY, & VACANCY
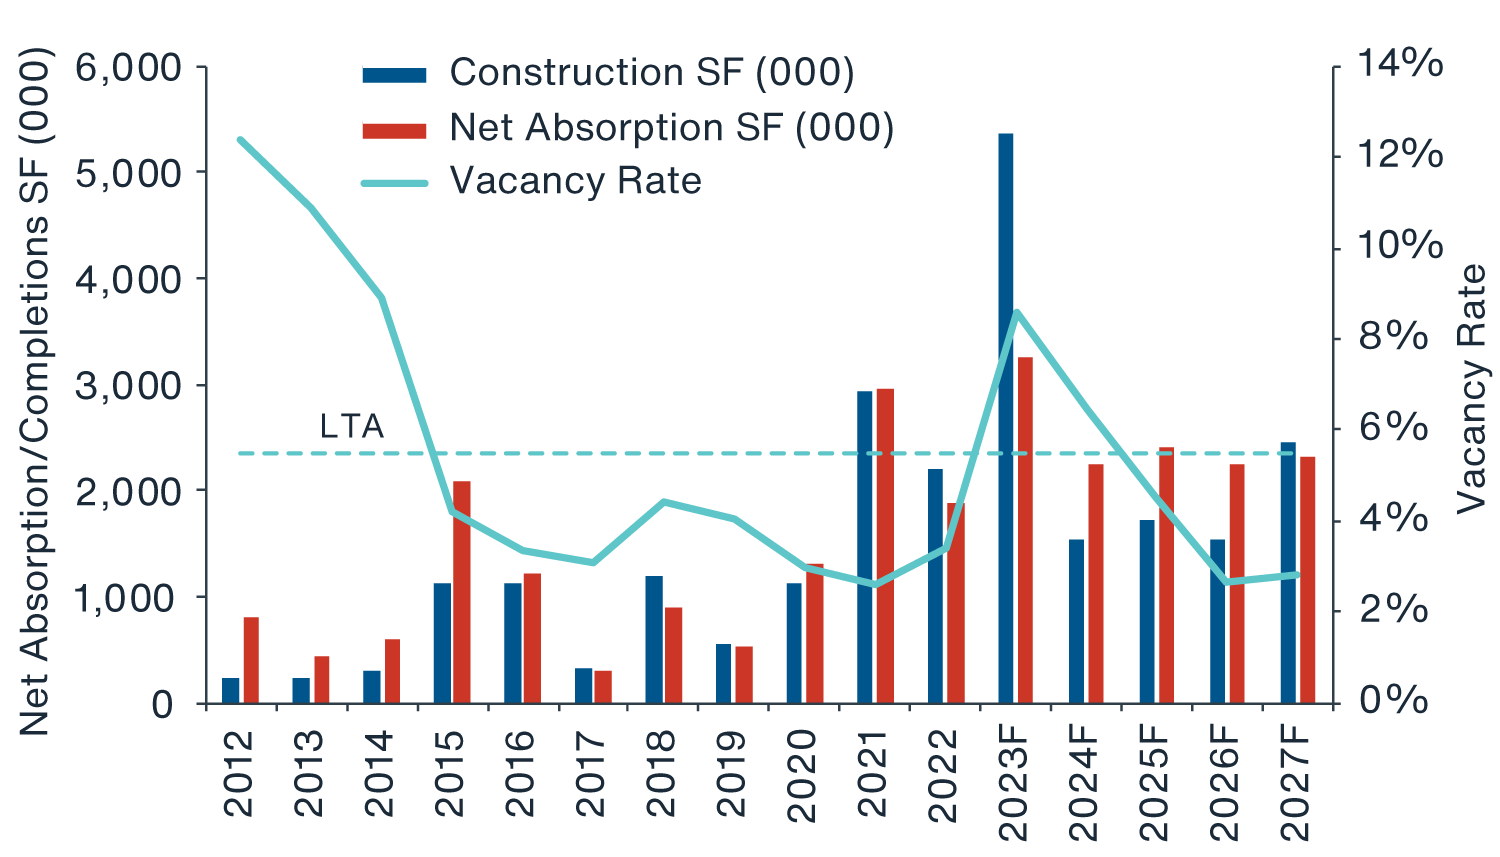
Source: JLL, Clarion Partners Investment Research, Q2 2023. Note: Tier 1 net absorption and completion trends are aggregates of Boston, SF Bay Area, and San Diego; these life science markets are a proxy for the national series. Life science submarkets: East Cambridge (Boston), South San Francisco (SF Bay Area), Torrey Pines (San Diego). Forecast from Clarion Partners Investment Research. Long-term average = LTA.
Nevertheless, speculative supply has recently been elevated. Much of the new pipeline is driven by less experienced operators and includes projects outside of the core clusters. These two factors have impacted the scale of existing stock and overall market occupancy levels. As new purpose-built supply increases, landlords are increasingly taking on the responsibility for covering fit-out costs. These expenses, which traditionally were paid by tenants, can be substantial and often involve delivering spaces that are move-in ready, or in 'turnkey' condition. We therefore recommend an ongoing focus on premier Tier 1 locations that may be more insulated from peripheral supply pressures.
LONG-TERM DEMAND DRIVERS
The long-term demand drivers for the life sciences industry and real estate remain compelling. The three major sources of capital (private venture capital, public funding, and corporate biopharma) have remained near their record highs, and 2023 funding is on track to exceed the pre-pandemic level in 2019
(Figure 6).
FIGURE 6: LIFE SCIENCES FUNDING BY CAPITAL SOURCE ($ BILLIONS)
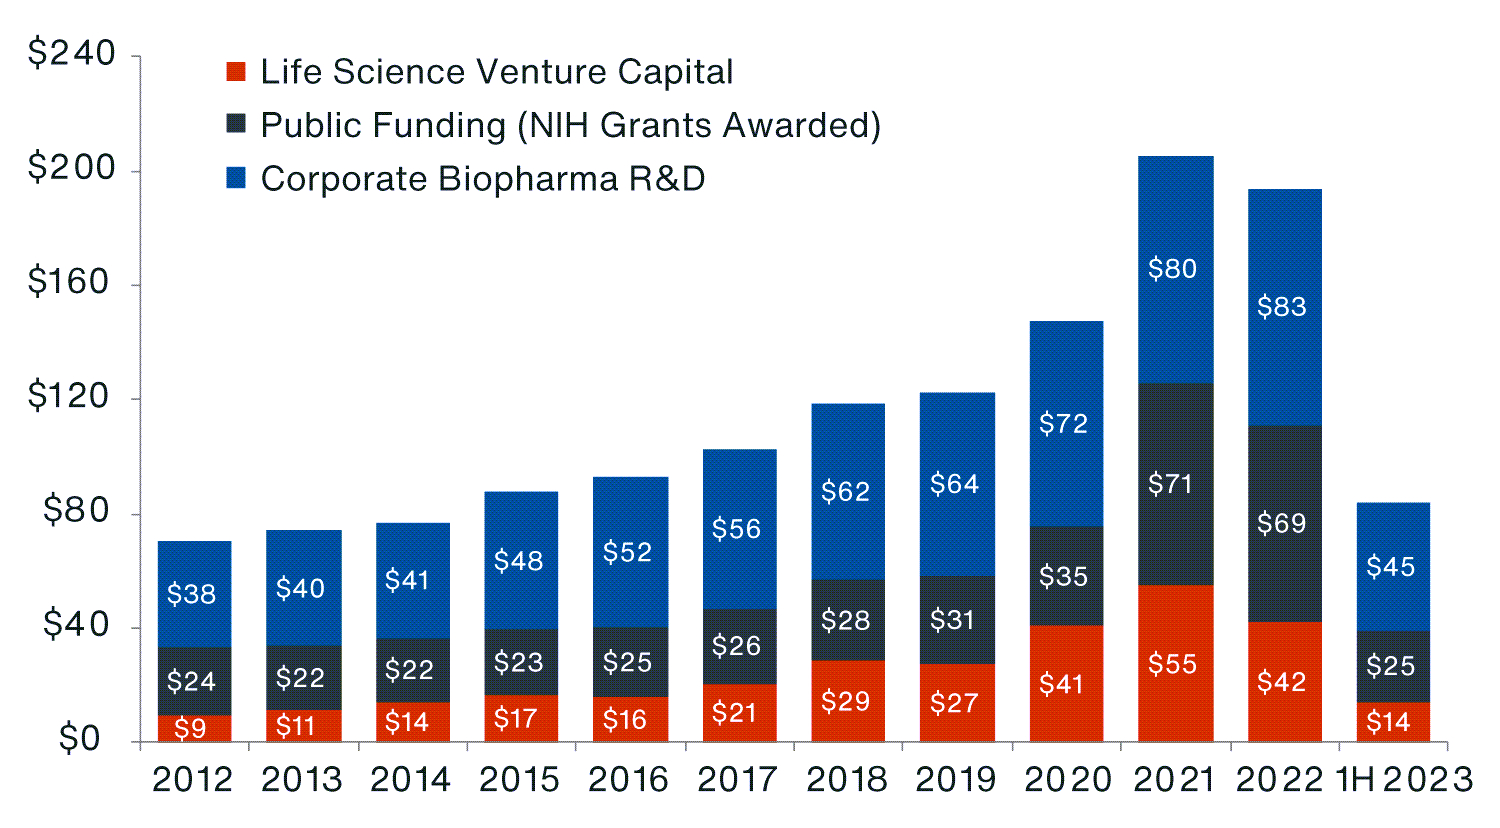
Source: CBRE, PhRMA, National Institutes of Health, Pitchbook, Clarion Partners Investment Research, Q3 2023. Note: 1H 2023 corporate biopharma R&D data were estimated by Clarion Partners Investment Research as of August 2023.
Clarion Partners remains optimistic about the future performance of the life science alternative property sector for the following reasons:
-
The National Biotechnology and Biomanufacturing Initiative. In September 2022, President Biden signed an Executive Order providing more than $2 billion to accelerate U.S. biotechnology and bioeconomy innovation to ensure America’s preeminence as a global leader within these industries and drive economic and societal progress nationwide. More specifically, the initiative aims to:
-
Grow domestic biomanufacturing capacity;
-
Expand market opportunities for bio-based products;
-
Drive R&D;
-
Streamline regulations for biotechnology products; and
-
Build a thriving, secure global bioeconomy with partners and allies.14
-
Mission Critical Use. Many life sciences buildings serve as mission critical facilities, which contain essential business activities and proprietary R&D activities. These sites are essential to operations and cannot be replicated. Furthermore, the internal systems are unique to each location and cannot be accessed remotely.
-
Demographics/Aging Population. Seniors account for a rising share of the U.S. population and a disproportionally large share of total healthcare spending. The cohort has risen from 15% of the U.S. population in 2015 to about 18% in 2023 and will likely grow to over 22% by 2040.15 At the same time, life expectancy has also increased. On average, seniors spend over $16,000 per annum on healthcare.16
-
Post-Pandemic Era. The global COVID-19 pandemic was undoubtedly a boost for life sciences funding and fueled new medical and drug treatments for commercialization. At the same time, the Food & Drug Administration (FDA) has improved their approval process, leading to more novel drug and biological approvals. New drugs in the clinical trial stage have remained at an historic high, and there is a robust pipeline of activity for future FDA approvals.17
-
Rapid Ongoing Growth in Health Care Spending. Over the next five years, national health care spending is projected to grow at an average rate of 5.4% per year and is expected to account for about 20% of U.S. GDP by 2030.18
-
Corporate BioPharma Well-Capitalized. Corporate biopharma R&D investment has climbed notably every year over the past decade. In 2022; however, private venture capital investment moderated slightly amidst the broader slowdown in the macroeconomy. On the other hand, global pharmaceutical companies now collectively hold $700 billion in cash on balance sheet for new acquisition and investment, which we expect will continue to drive the boom in M&A and clinical trial activity.19
-
More Synergy between Health Care and Technology. There is more and more crossover between health care and technology innovation. This synergy has spurred tremendous growth across the U.S., particularly in markets (Seattle, for example) with existing high-tech clusters. Some of these clusters have become increasingly expensive, resulting in a spreading to new growth centers.
-
Rising Biotechnology & Life Sciences Employment. Life sciences and biotechnology employment reached a record high at the start of 2023. Over the past five years, annual average employment growth for biotechnology was 9.4%, while it was 0.9% for all U.S. nonfarm jobs.20 We expect this trend to continue in the years ahead, and the demand for this labor to remain robust. Previous cycles suggest any further slowdown in life science employment may not be as severe as that of the broader economy.
OUTLOOK
Investment Characteristics
An increasing number of institutional investors have begun to pursue life sciences real estate. Investors are attracted to the sector’s strong property-level fundamentals, which are less correlated to economic cycle risks due to the more inelastic demand from the healthcare industry. Overall, life sciences assets have demonstrated core-like investment characteristics, which include:
- Relatively stable cash flows;
- Lower measured risk;
- A growing investable market;
- Strong track record of net operating income (NOI); and
- Higher tenant retention rates.
U.S. life sciences real estate NOI growth has well outpaced that of traditional office from 2005 to 2022
(Figure 7). According to Green Street Advisors, the five-year forecast is very strong for the sector as well.
FIGURE 7: LIFE SCIENCES VS. TRADITIONAL OFFICE: SAME-STORE NOI GROWTH
Source: Green Street Advisors, Clarion Partners Investment Research, Q2 2023. Note: Forecast is from Green Street Advisors. Alexandria Real Estate (ARE), the one pure-play publicly listed life sciences REIT, is used as a proxy for the performance of life sciences real estate.
Attractive Investment Opportunities
Clarion Partners believes investing in premier lab space is a compelling investment opportunity over the long term. Occupiers continue to pay top rents for the best locations and facilities. We recommend Class A assets in the two tiers below:
Tier 1:
- Boston/Cambridge (East Cambridge, the Seaport, Longwood Medical, & surrounding inner-core submarkets: Watertown and Somerville)
- San Francisco (South San Francisco, Mission Bay, MidPeninsula, & Emeryville/Berkeley)
- San Diego (Torrey Pines, University Towne Center, & Sorrento Valley)
Tier 2:
- Seattle (South Lake Union)
- Raleigh-Durham (Research Triangle)
- NYC/NJ - Maryland/DC - Philadelphia
In these top life sciences clusters, there is generally strong demand for Class A inventory, which has led to low vacancy levels and rent growth that has outperformed the U.S. commercial real estate sector average. We also recommend biomanufacturing and GMP facilities in strategic locations as drug production becomes increasingly localized.
Risk Factors
Potential risks to the outlook mainly include:
Near Term
-
A large wave of new supply
-
Continued weaker private venture capital and public funding
-
Persistently high interest rates
-
A labor market slowdown and/or recession
Long Term
-
Health care regulations/drug pricing control
-
Patent expirations looming at many companies
-
New tech disruptions, such as artificial intelligence (AI), impacting demand for new space and employment
CONCLUSION
Health care is one of the fastest-growing industry sectors in the U.S. Going forward, Clarion Partners believes that life sciences real estate will continue to offer attractive risk-adjusted investment opportunities as it transitions from a niche property sector to a more mainstream alternative sector over the next two decades.
We are focused on developing and acquiring assets in established and high-growth life sciences clusters with supply constraints and durable long-term rent growth. We believe it remains an excellent time to concentrate on this expanding sector, considering the limited number of large, institutional investors in the space and its compelling long-term secular demand drivers.