This report represents the views of Clarion Partners as of March 2020 and does not address any impact or potential impact of the COVID-19 pandemic.
THE COMEBACK OF U.S. SUBURBS
Much of live-work-play occurs beyond the central business districts (CBDs) and downtowns of the biggest U.S. cities. Over 75% of those residing in the most populous metros live in the suburbs or exurbs.1
Most of the largest office and housing markets nationwide are, in fact, predominately suburban. In recent years, the boom in the urban fringes and suburbs that lie just outside of major U.S. cities has accelerated, in large part, because such places are generally an easy commute away from thriving cities or corporate outposts.2
Over the past decade, there has been a greater dispersion of the U.S. population with a healthier and more diversified economy and housing market. Also, urbanization trends are occurring rapidly in areas outside of the downtown in a broader set of markets. Trends favoring such locations are mainly due to three factors: 1) aging Millennials, 2) low affordability in the CBDs of the biggest U.S. cities, and 3) the comeback of select suburban office markets in more supply-constrained areas. At the same time, more institutional capital is also being invested outside of areas defined as the CBD. More high-performing, mixed-use commercial real estate is in less urban settings, as young and old alike are fleeing dense cities for a significant improvement in quality of life.3
U.S. COMMERCIAL PROPERTY TRANSACTION VOLUME
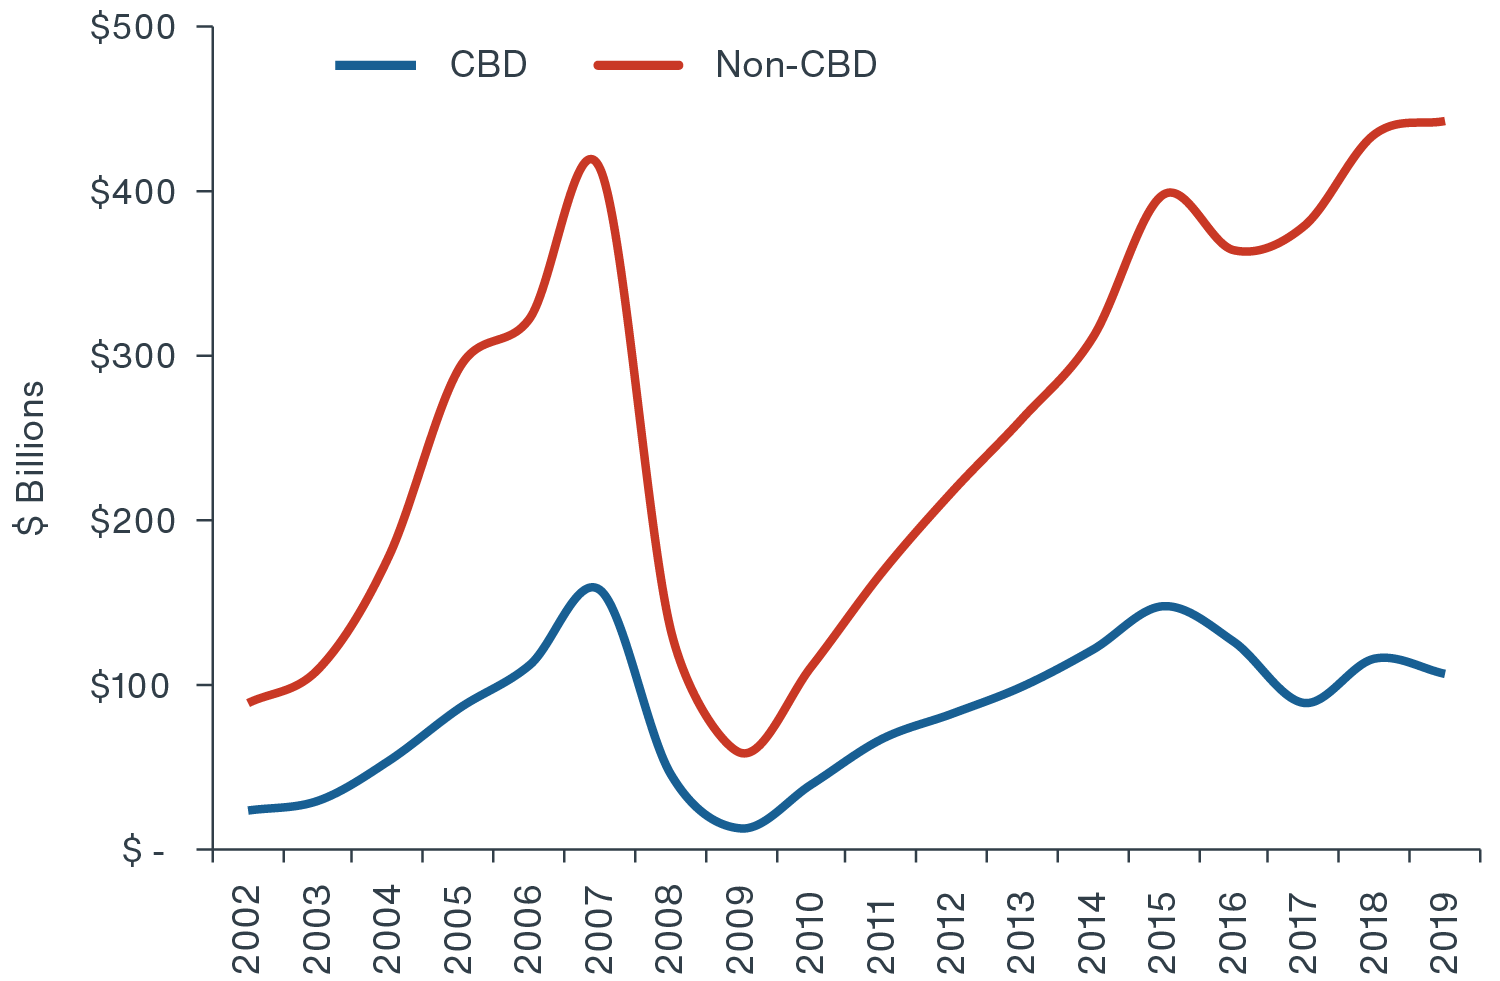
Source: Real Capital Analytics, Q4 2019. Note: CBD represents 77 of the largest U.S. cities.
RECENT CBD VS. SUBURBAN GROWTH TRENDS: DRIVEN LARGELY BY AGING MILLENNIALS AND LOW AFFORDABILITY IN HIGH-COST CITIES
The suburbanization of America has been a multi-decade-long trend except for a few years after the global financial crisis.4 The return to the city trend seen at the beginning of the decade has now reversed. Over the past decade, CBD population growth exceeded suburban areas briefly from 2010 to 2014, however, the suburbs have re-accelerated and outperformed the CBD every year since 2015.5
ANNUAL POPULATION GROWTH: CBD VS. SUBURBAN
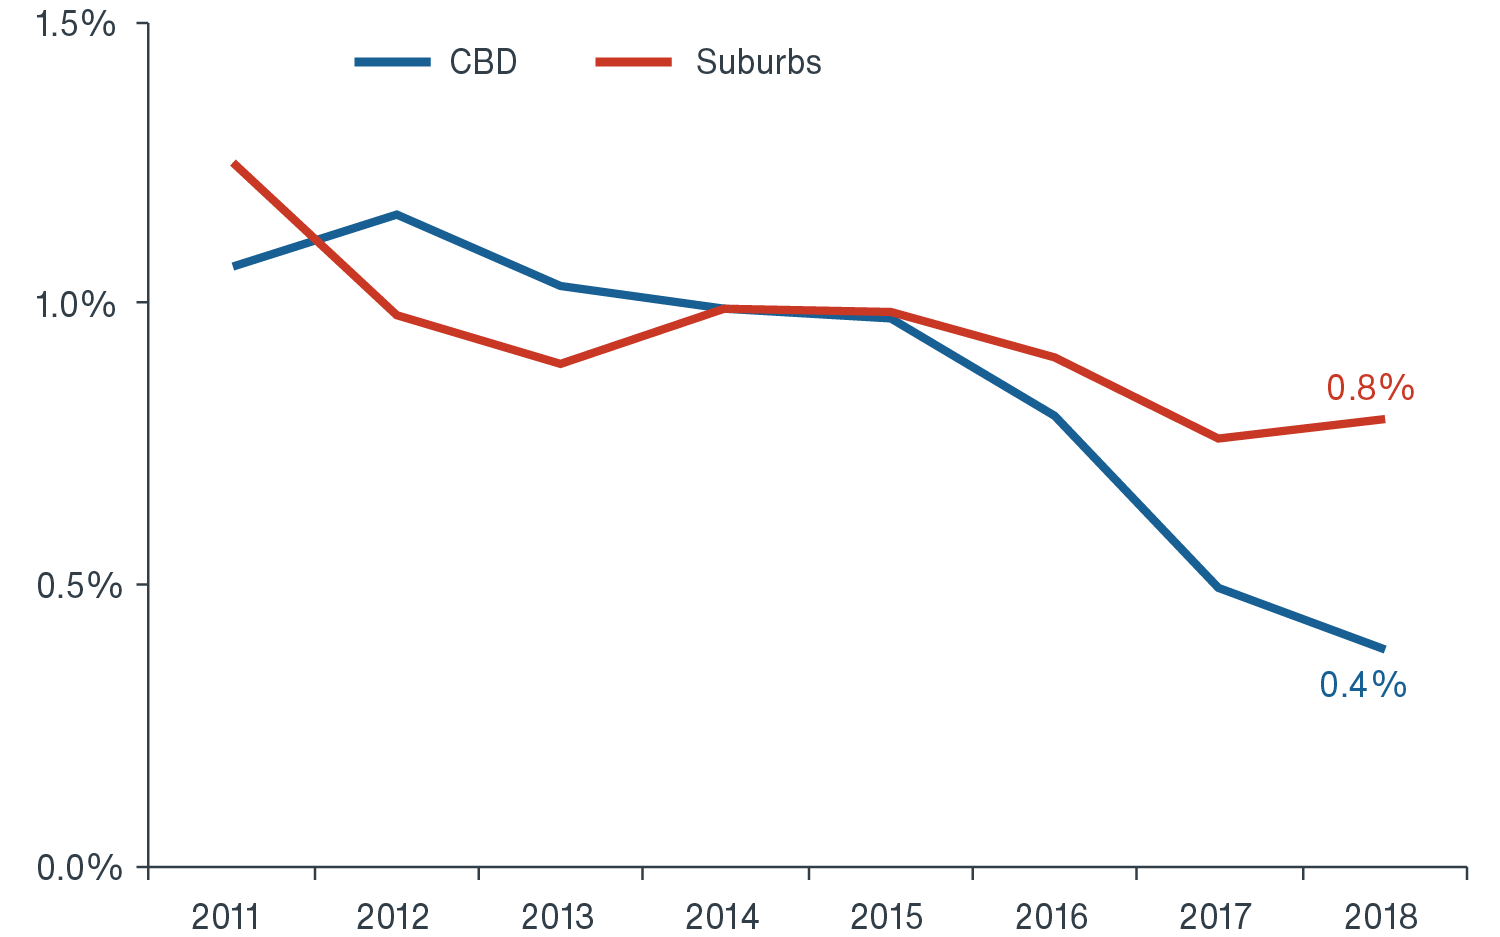
Source: U.S. Census Bureau, Clarion Partners Investment Research, Q4 2019. Note: Includes 53 metropolitan areas with populations over one million. Here ‘CBD’ is based on the ‘Primary City,’ which is the metropolitan area’s largest city and ‘Suburbs’ is based on the areas outside of the ‘Primary City’. Approximate total population of CBD = 100 million, suburbs = 175 million, and exurbs = 50 million. Most recent data for full-year 2018.
Sprawling, low-rise cities, such as Los Angeles, Seattle, Boston, and Dallas are more of the American ‘norm’ than a few dense, high-rise metropolitan areas, such as New York and San Francisco, which are experiencing slower growth or population loss.6 Over the past year, the fastest-growing suburbs in large employment hubs were in Austin, San Jose, Dallas, Raleigh, Nashville, and Charlotte.7 These areas generally offer more space, safety, schools, walkability, and outdoor activities, along with all essential services.
There are three primary reasons for this trend reversal:
-
Aging Millennials. By 2030, Millennials are expected to account for about 75% of the workforce.8 Of the approximately 75 million in this generation, 30.9 million are currently over the age of 30, and 16.2 million households already have children. More in this cohort will be drawn to residential living that mixes city and small-town amenities.
-
Low affordability in the CBDs of Big U.S. Cities. The CBDs of top employment hubs are too expensive for most American households. In recent years, there has been more outmigration from expensive urban centers and spillover to urban fringe areas (areas touching the urban core) and nearby premier suburbs.9 More often, buying or renting a home occurs further from downtown employment hubs. Close-in suburbs with top schools and lifestyle amenities are becoming more popular.
-
The Comeback of Select Suburban Office Campuses & Buildings. The expansion of suburban office campuses throughout the U.S. has been greatly influenced by big tech companies, such as Microsoft in Redmond outside Seattle and Apple in Cupertino nearby San Jose. More recent examples are Toyota’s new campus in Plano (just north of Dallas) and the Amazon Robotics and TJX Companies offices in the Boston suburbs.
SUBURBAN COMMERCIAL REAL ESTATE INVESTMENTS HAVE OUTPERFORMED
In recent years, office and multifamily real estate investment performance has been better in the suburbs than in the CBD, and the outperformance has also widened. The NCREIF Property Index (NPI) office returns and CBRE-EA office market data indicate:
- Of the 865 office markets tracked by CBRE-EA, 87% (or 755) are in the suburbs, while 110 are in the CBD.
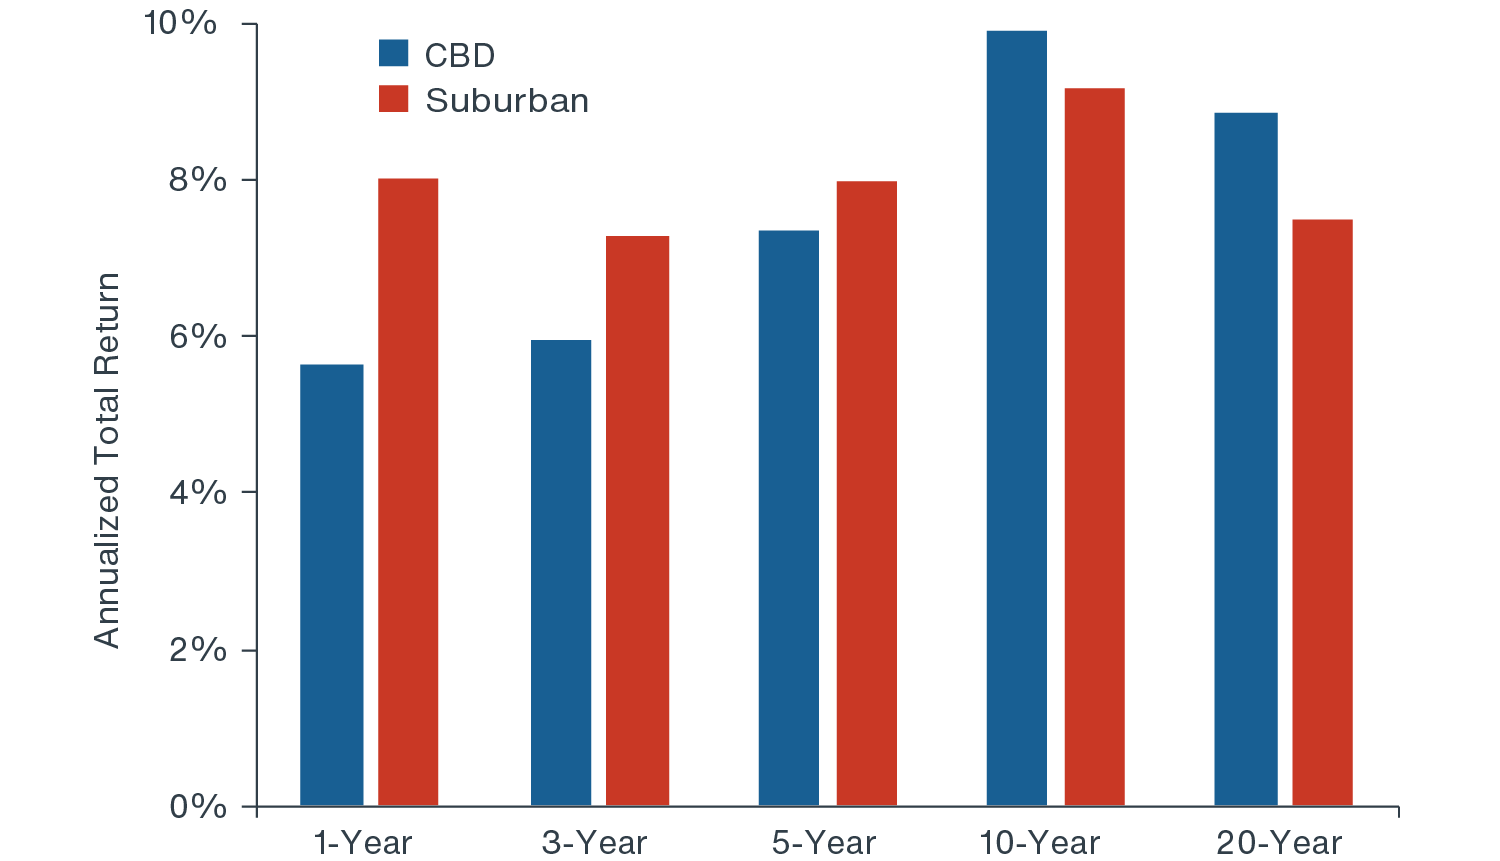
- Over the past 1-, 3-, and 5-year timeframes, NPI office returns in the suburbs have surpassed those in the CBD after decades of outperformance in the CBD (Figure 1)
- From 2009 to 2019, over 70% of new office deliveries were in the suburbs.10
- Top returning suburban office markets were Boulder, Cambridge, Austin, San Jose, Oakland, and Seattle. (Figure 2).
NCREIF OFFICE TOTAL RETURNS: CBD VS. SUBURB
(Figure 1)
NCREIF SUBURBAN OFFICE TOTAL ANNUAL RETURNS
(Figure 2)
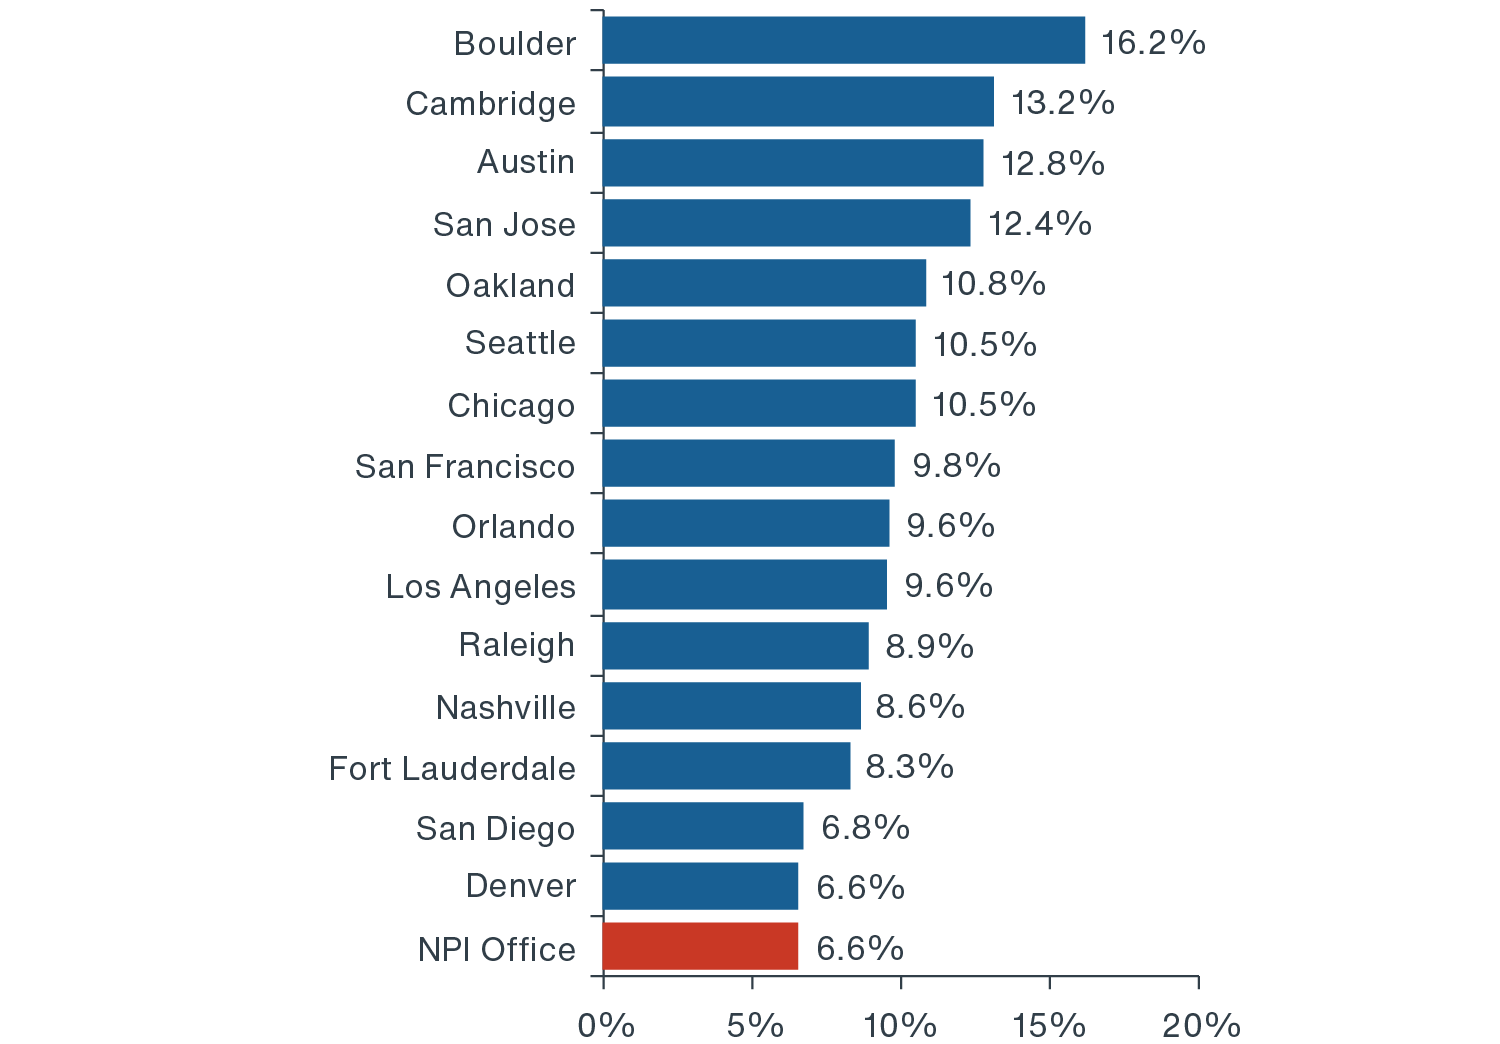
Source: NCREIF Property Index, Clarion Partners Investment Research, Q4 2019.11
At the same time, multifamily NPI returns and CBRE-EA market data reveal a similar pattern:
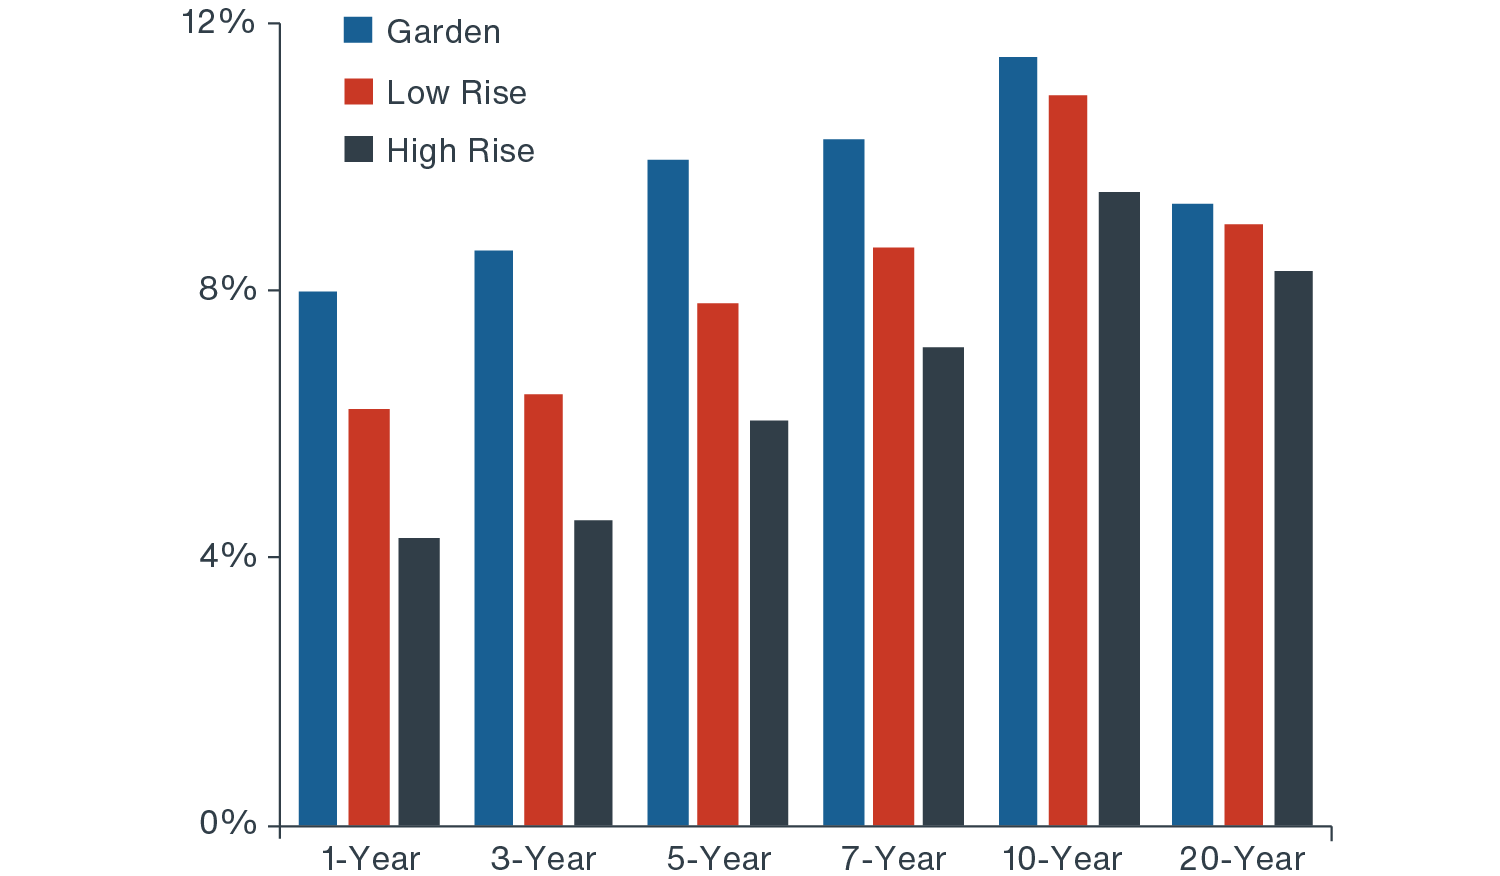
- Garden-style multifamily, which tends to be outside CBDs, has significantly outperformed over the short and long-term. In recent years, the divergence between garden-style and high-rise returns has widened (Figure 3).12
- At the same time, multifamily effective rent growth at properties on the urban fringe and suburban areas has exceeded that of the CBD for about five consecutive years (Figure 4).
U.S. MULTIFAMILY RETURNS BY SUBTYPE
(Figure 3)
MULTIFAMILY RENT GROWTH: URBAN, URBAN FRINGE & SUBURBAN
(Figure 4)
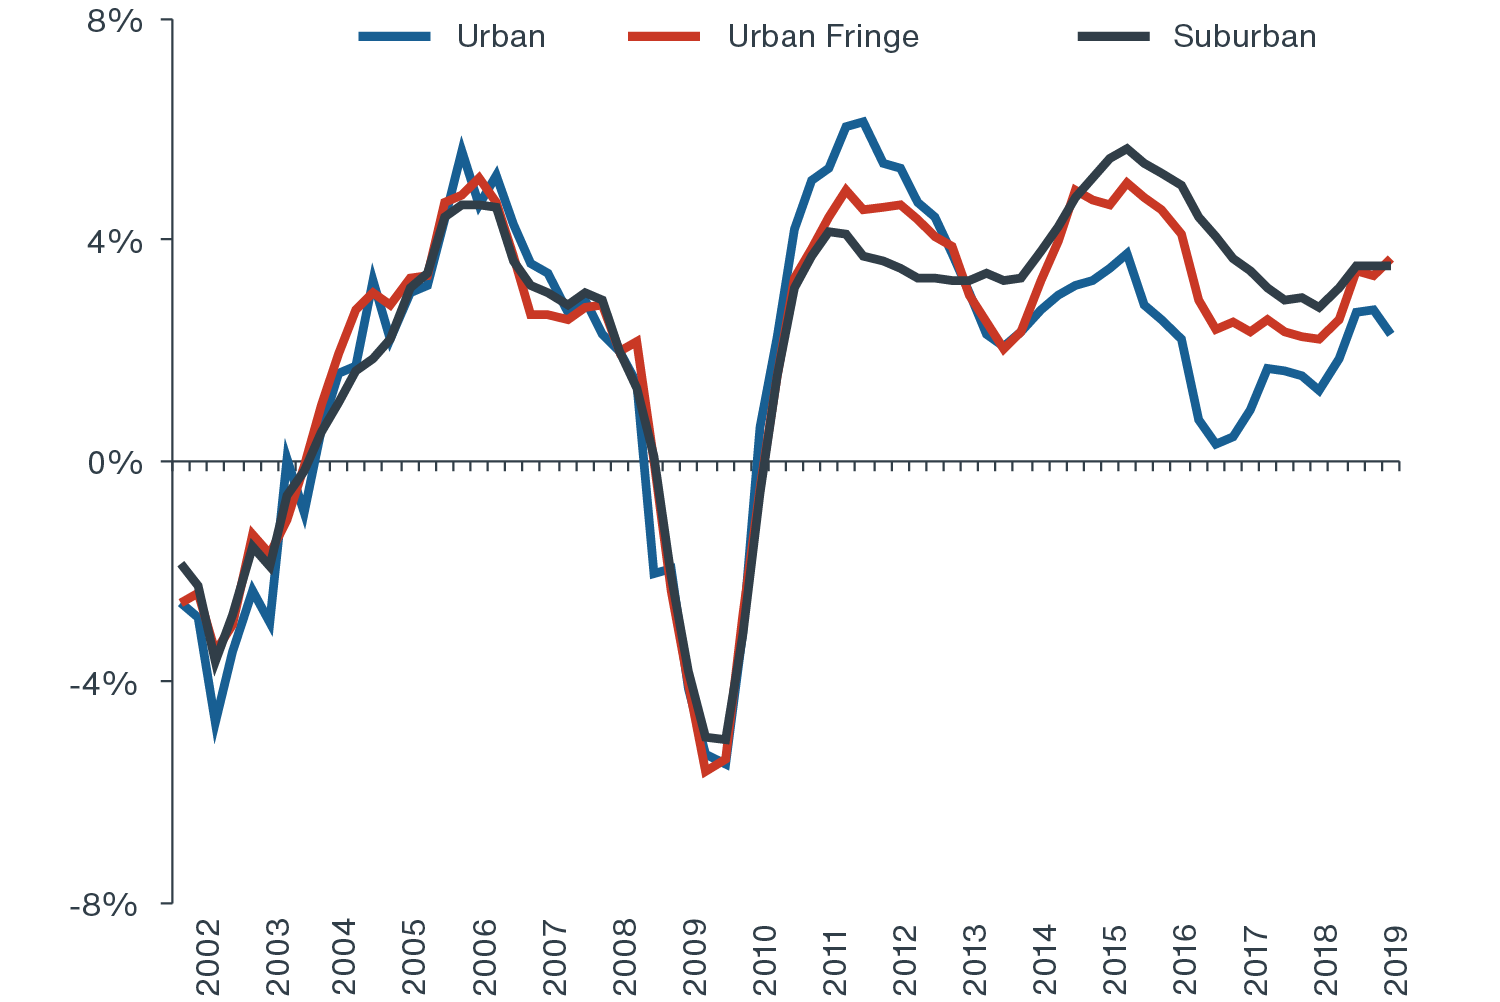
Source: CBRE-EA, Q3 2019. Note: CBRE defines urban fringe as an area touching the urban core or CBD.
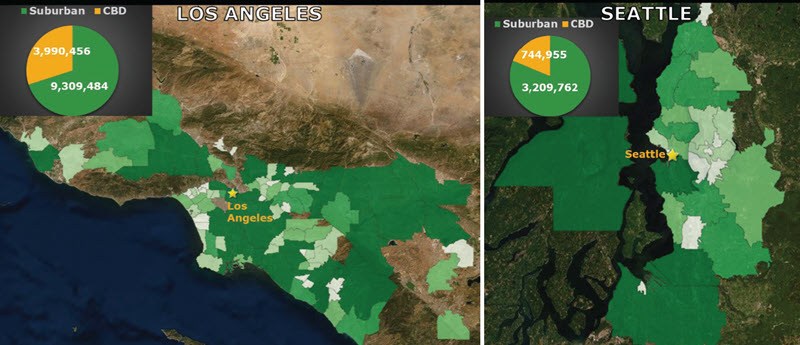
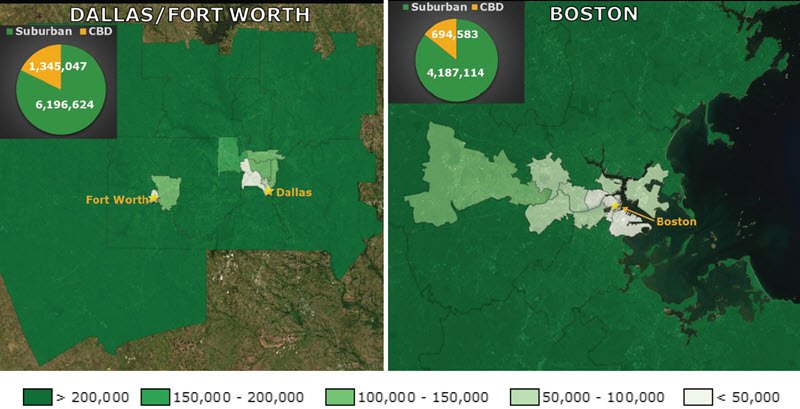
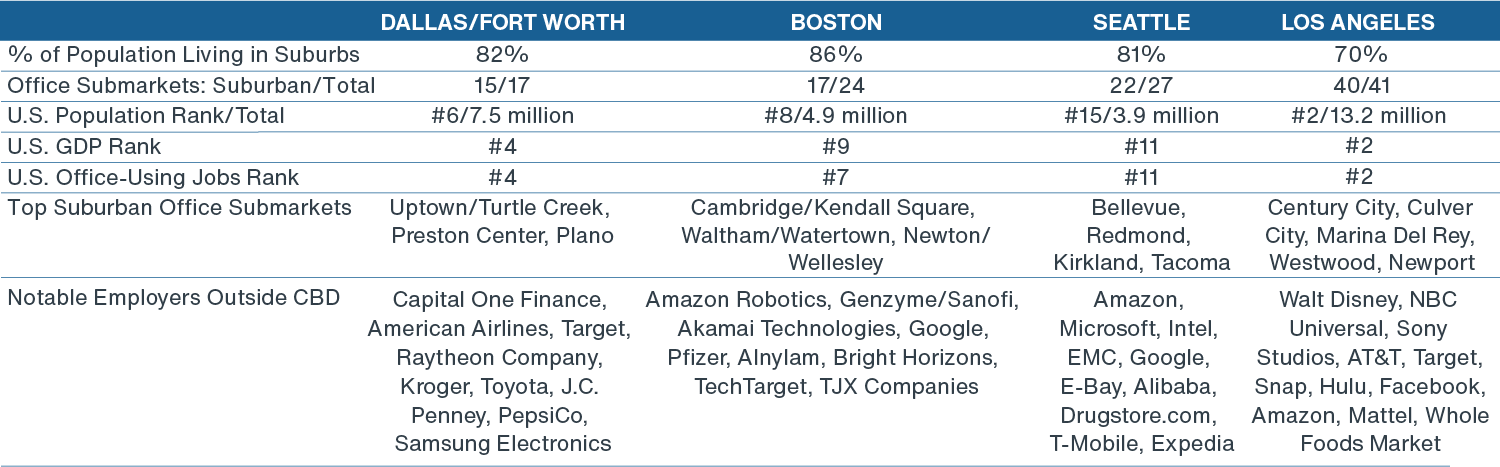
LARGE & SUBURBAN HIGH-GROWTH U.S. CITIES
In most of the largest U.S. cities, relatively few people actually live in the CBD.13 Furthermore, most of the top office submarkets are outside the primary CBD or downtown. Below are four examples of the largest and most expansive U.S. cities in different regions, which are also reporting strong recent job growth: Los Angeles, Seattle, Dallas/Fort Worth, and Boston, which illustrate the scale and density of the population outside center city. More and more big tech, health care, consumer product, and energy-related firms are now in or expanding rapidly in the suburbs of these cities, and we are optimistic about future growth prospects in select high-barrier-to entry suburban nodes.
TOTAL POPULATION OF SELECT SPRAWLING U.S. CITIES
RECOMMENDATIONS: SWEET SPOTS IN THE URBAN FRINGE & SUBURBS
A big comeback of areas outside of large and high-growth metros is well-underway. Clarion Partners foresees even greater movement beyond traditional CBDs of U.S. cities. Affordability, work-life balance, and job proximity are now likely to be key factors with aging Millennials, as well as Gen Z, Gen X, and Baby Boomers. More and more, outer areas of the big cities have densified and created live-work-play areas that offer high-paying jobs, lifestyle amenities, health care, and educational services.
We see attractive investment opportunities in the below more suburban concepts:
-
Professionally-Managed Garden-Style and Low-Rise Multifamily
With aging Millennials, we believe the ongoing acquisition of well-branded and professionally-managed garden-style and low-rise apartments is a smart play. More Millennials will require spacious and amenitized living arrangements. At the same time, retirees will seek to downsize and look for retirement housing at a manageable cost and potentially near family. We foresee robust demand in this segment in high-growth markets with a strong demographic story.
-
Select Office Buildings & Campuses in Relatively Supply-Constrained Premier Suburbs
Buying office in premier suburban and urban fringe areas is likely to offer stable long-term cash-flow. More corporations are now in or expanding here and building dynamic standalone headquarters, buildings, and/or campuses. Various industries are also investing in regional economic development in areas outside of CBDs, which are less land-constrained and offer better value, both from a tax and cost of living perspective.
-
Redevelopment of Traditional Retail
Throughout the U.S., there are over two million retail properties categorized generally as neighborhood, community, strip, or power center.14 Only about 160,000 of these are institutional-quality assets. Many suburban and exurb retail formats serve as local community anchors. There will continue to be large-scale redevelopment of retail, as well as massive re-merchandising and mixed-use and warehouse conversion efforts at well-located A, B, and C properties. The new tenant mix will include: food & beverage, sports and recreation chains, day care, outpatient health care facilities, autocare, banks, and entertainment venues and fitness concepts.
-
Single-Family Rentals & Manufactured Home Communities
Given the national affordability crisis in a rising number of urban areas, single-family rentals (SFRs) and manufactured home communities will become more attractive housing options and rise as a share of total rental housing. Today, about 20 million households live in SFRs, mobile homes, RVs, and similar dwellings. With widespread functional obsolescence across the SFR market, there is now a scalable opportunity in pre-fab and modular construction, as well as owning the underlying land.
-
America's Two Most Expensive Cities: New York City & San Francisco
New York City and San Francisco/San Jose remain two of the largest metropolitan areas and office-using jobs markets. Both economies are well-diversified and hold sizeable and talent pools. In the years ahead, millions of Millennials will disperse to the urban fringe and suburbs as they have families and seek out more space, especially since these are two of the most expensive U.S. housing markets.
The San Francisco Bay Area suburbs are home to some of the country’s most impressive suburban office markets. Santa Clara, Sunnyvale, North San Jose, Palo Alto, Mountain View, Redwood/ Foster Cities, San Mateo, Redwood City, and Menlo Park are a few, where some of biggest names are headquartered, such as Apple, Google, Cisco Systems, Intel, Tesla, Facebook, Oracle, and eBay Inc. Lower cost areas in East Bay (or Oakland) are likely absorb some spillover.
In addition to the outer areas of the “Superstar Cities” (New York, L.A., San Francisco Bay Area, and Boston), Clarion Partners is optimistic about future growth prospects of recent high-returning suburban office markets, such as Oakland, Los Angeles, and Seattle. We also recommend acquiring premier Class A office assets in few lower-cost areas, such as Orlando, West Palm Beach, Portland, and Raleigh, which have compelling appreciation potential. Nearby multifamily, retail, and industrial assets are likely to benefit.