A SUMMARY OF RECENT RELOCATION ACTIVITY
The onset of the COVID-19 pandemic largely accelerated many location changes that began before March 2020. Nationwide, some migratory patterns related to American industry and demographic shifts became more pronounced by type of region, metro, and location − some areas experienced unprecedented booms, while others reported sizeable declines. Clarion Partners' analysis indicates that post-pandemic U.S. relocation activity showed mainly four trends:
1) Out-migration from large “blue” states;
2) Stronger growth in certain small/mid-sized cities;
3) Relocations to many Sun Belt markets; and,
4) A move to the suburbs.
Much of this movement is driven by relative cost of living, quality of life, lower taxes, a business-friendly environment, and demographics, such as a baby and retirement boom. At the same time, new job creation and remote work are more and more dispersed outside of the six major markets.1
ACCELERATED OUT-MIGRATION FROM LARGE “BLUE STATES”
In 2021, departures from large “blue states" hastened with population losses in many big U.S. cities
(Figure 1). While exits on such a scale may very well be a temporary phenomenon related to the pandemic, domestic out-migration from these areas has been a longer-term shift.
FIGURE 1: ANNUAL DOMESTIC MIGRATION BY STATE (2019-2021)
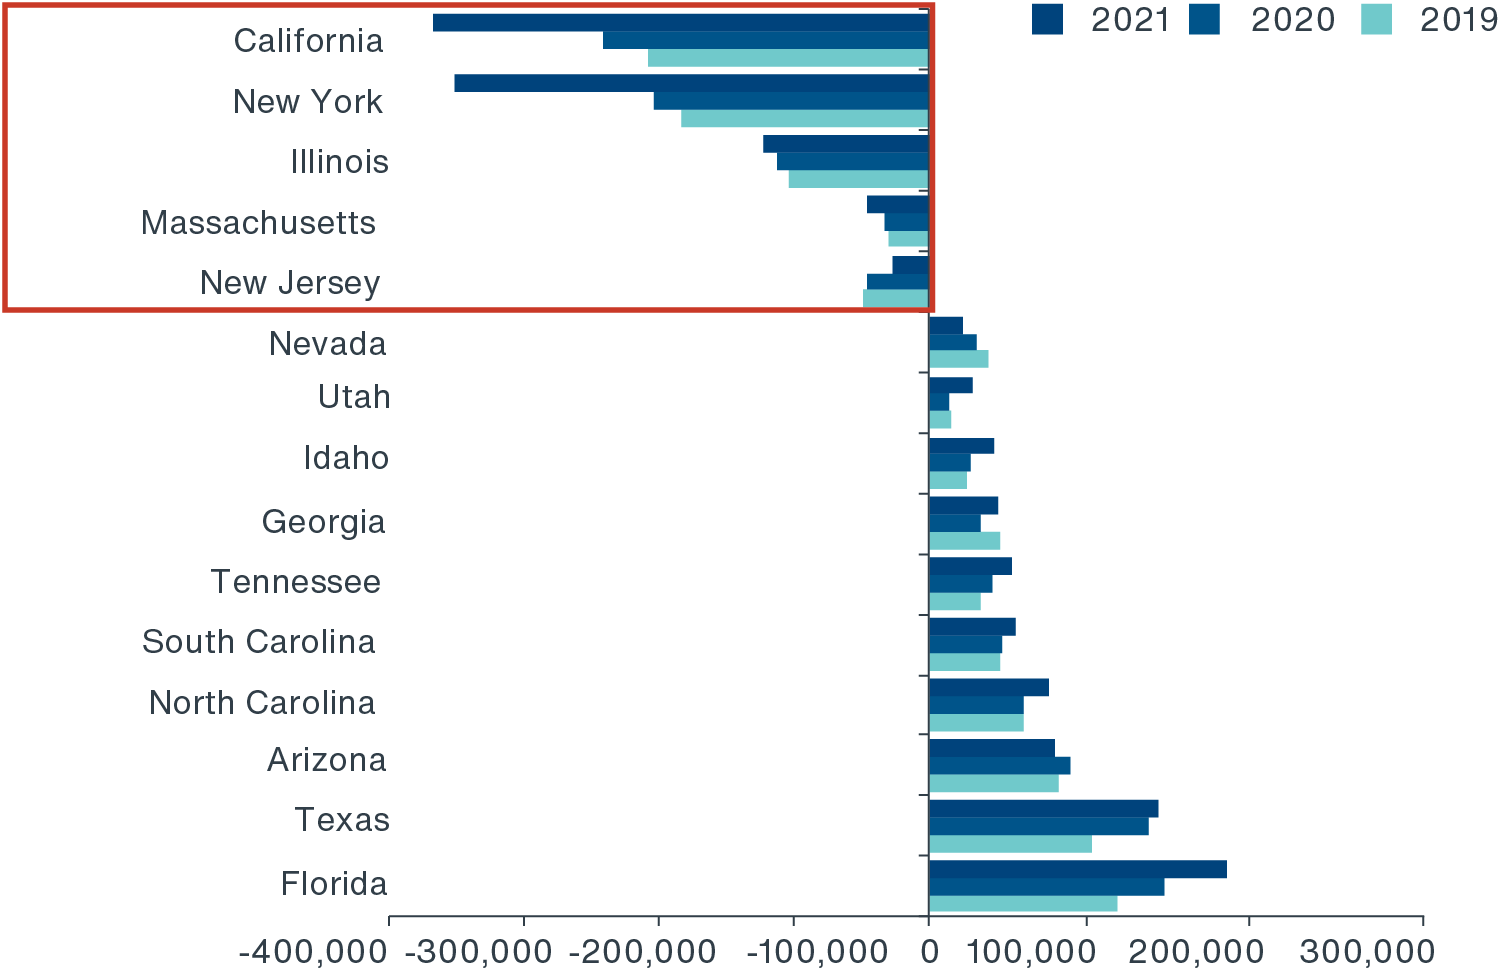
Source: Brookings Institute, U.S. Census Bureau, Clarion Partners Investment Research, Q1 2022.
- From July 2020 to July 2021, the largest cities in the states of California, New York, and Illinois reported the greatest population declines. New York, Los Angeles, Chicago, and San Francisco lost over 700,000 residents to domestic outmigration. Alternatively, Phoenix, Atlanta, and the biggest metros in Florida and Texas gained more than a total of 261,000 residents combined.
- The exodus from a handful of large cities is a notable contrast from a decade ago, when urban cores in most gateway markets were growing, then bolstered by the rising popularity of urban living and a decades-long boom in immigration.
STRONGER GROWTH IN SMALL & MID-SIZED CITIES
Despite the overall slowest U.S. population growth in over a century, a number of small and mid-sized metro areas benefited from migration trends last year (Figure 2). Many Americans left large cities for less densely populated environments.
- As a group, the major metro areas (those with populations exceeding one million) saw an absolute population loss during the pandemic.2 Twenty-six out of 56 reported a decline in residents compared with 15 from 2019 to 2020.
- Last year, the fastest-growing mid-sized cities were in South Carolina, Idaho, Utah, Florida, Arkansas, and Alabama
(Figure 2). At the same time, small towns in many U.S. micropolitan and non-metropolitan areas also saw solid population increases, which were coined 'boom towns' during the pandemic.3
FIGURE 2: 2021 POPULATION GROWTH RATE BY METROPOLITAN AREA SIZE
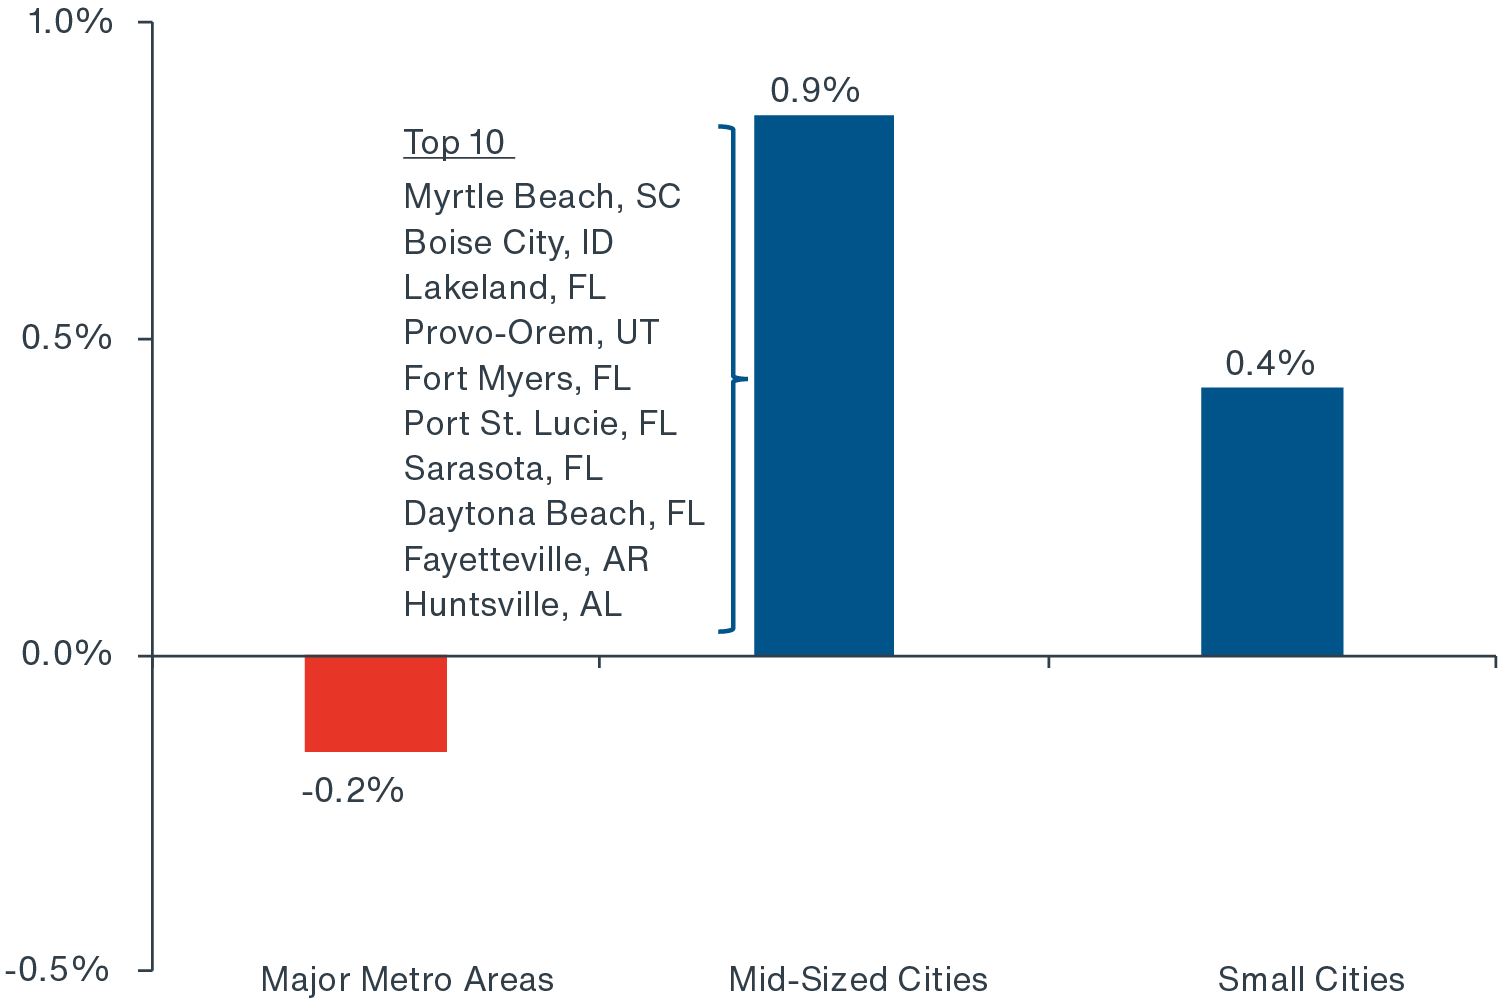
Source: Moody's Analytics, Brookings Institute, Clarion Partners Investment Research, Q1 2022. Note: Major metros = population +1,000,000, mid-size = 500,000 to 1,000,000, and small-sized = 50,000 to 499,000.
FIGURE 3: TWO-YEAR CUMULATIVE TOTAL DOMESTIC MIGRATION
GROWTH BY METRO (2020-2021)
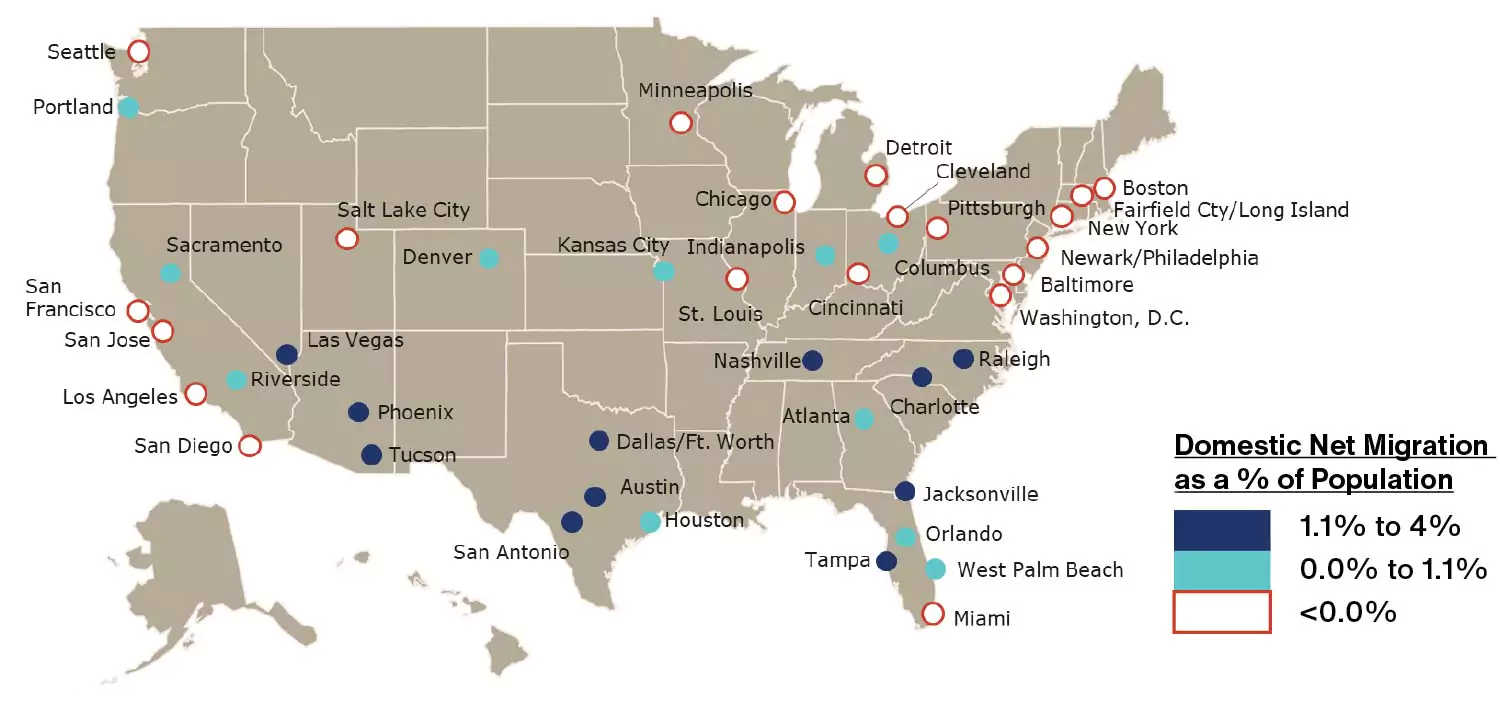
Source: U.S. Census Bureau, Clarion Partners Investment Research, Q1 2022. Note: Total net migration growth is calculated as a % of the previous year's population and is based on the cumulative growth for 2020 and 2021. The analysis uses annual data from July 2019 to July 2021; 2020 is preliminary and may be revised.
ROBUST IN-MIGRATION TO SUN BELT MARKETS
The in-migration to the Sun Belt has persisted for decades now; however, the pace of growth in several of these markets has strengthened in the past few years. The ten fastest-growing U.S. counties in absolute terms last year accounted for nearly 80% of the national total and were all located in Arizona, Texas, California, and Florida.4
- From 2020 to 2021, the top-ranking markets for total net migration as a percentage of population were Austin, Phoenix, Raleigh, Jacksonville, Tampa, Charlotte, San Antonio, Las Vegas, Dallas, and Nashville (Figure 3).
- Austin reported the fastest acceleration in net migration relative to the prior two-year period. Migration also accelerated into Phoenix, Jacksonville, Raleigh, and Tampa.
Not surprisingly, secondary markets, largely in the Sun Belt, have also reported a stronger job recovery relative to the pre-COVID prior peak. Austin, Dallas, Raleigh, Nashville, Jacksonville, Riverside, and Tampa are now more than 3% above their pre-COVID level. A few large, high-cost gateway metros have been much slower to rebound and are still below previous highs
(Figure 4).
FIGURE 4: PANDEMIC NET MIGRATION, HOME PRICES, & JOB GROWTH RECOVERY
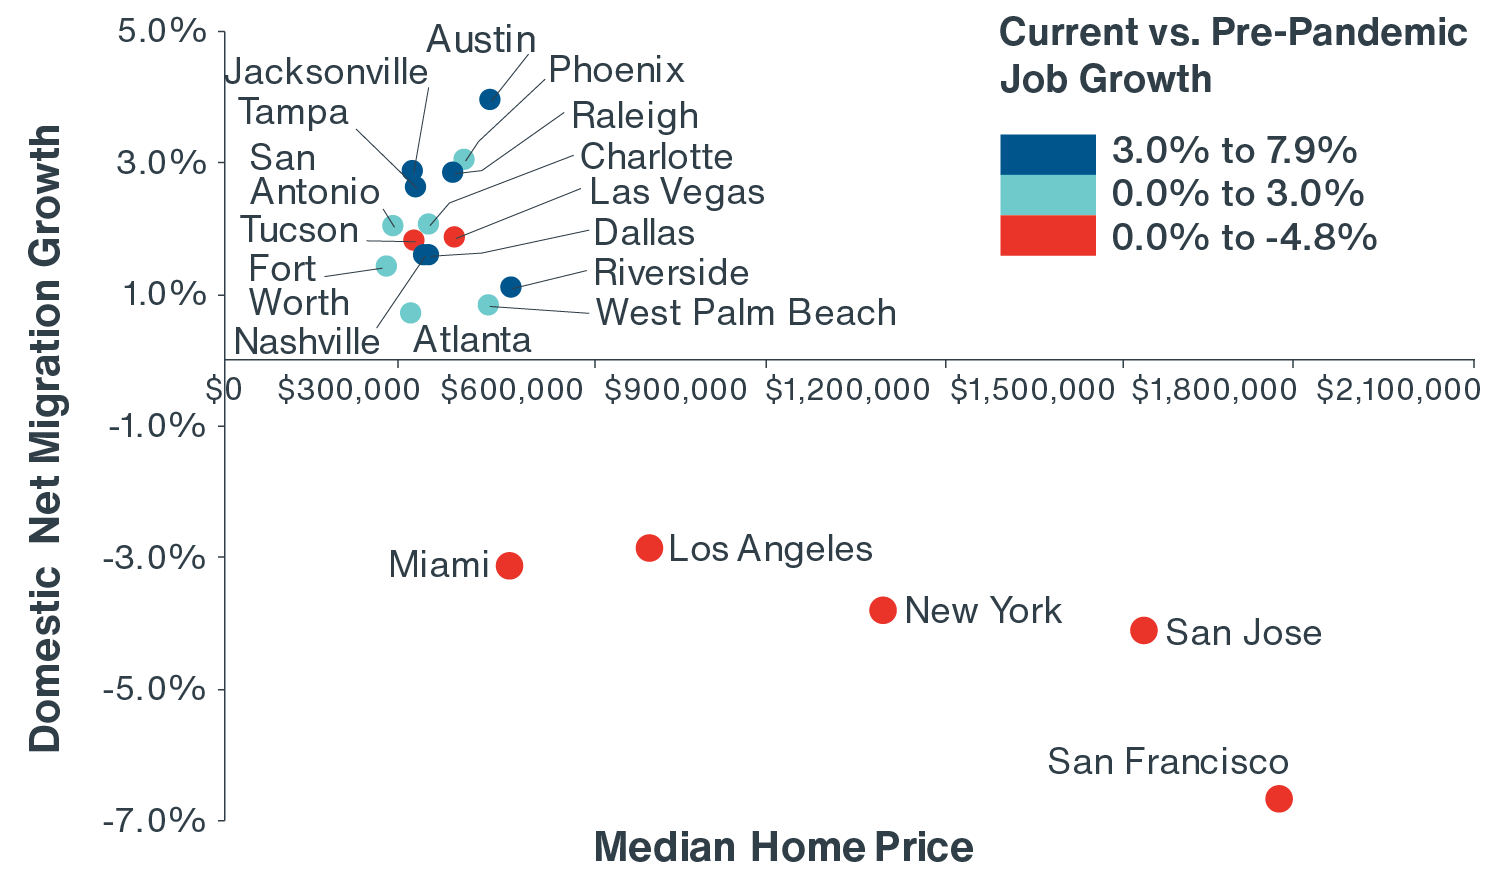
Source: Moody's Analytics, Clarion Partners Investment Research, Q1 2022. Notes: Domestic net migration % is cumulative total of 2020 and 2021 migration as a % of prior year's population, home price is the median as of December 2021, and non-farm job growth is calculated from February 2020 to March 2022. New York based on New York County.
These divergent trends are also reflected in home price appreciation across metro areas, with Sun Belt markets often seeing sharper growth. Many of the metros slower to recover jobs lost also report some of the highest home prices nationwide, a sign that people are increasingly relocating for a lower cost of living, now in many instances enabled by more remote work.
MOVE OUT TO SUBURBS
During the pandemic years of 2020 to 2021, many urban core counties within major U.S. metro areas reported an exodus. This was largely due to broader desires for more living space and access to outdoor natural amenities, as well as rising urban crime.5
- Most urban core counties of major metros saw faster population declines or slower growth than in any year during the 2010s
(Figure 5).6 Alternatively, outer-ring suburban counties in major gateway metros saw steady and, in some instances, robust population growth
(Figure 6).
- Subsequently, most major markets reported a significant pick-up in suburban multifamily rent growth in 2021 relative to the five-year pre-pandemic period. Sun Belt and Mountain markets typically led the way, and in many instances, a metro area’s suburban rent growth also greatly outpaced that of its urban core.
While urban coastal gateway markets may remain vibrant, outer-ring suburban locations could present relatively more attractive opportunities, especially given that many office workers may remain on a hybrid work schedule for now.
FIGURE 5: URBAN CORE VS. SUBURBAN COUNTIES ANNUAL POPULATION GROWTH RATE (2010-2021)
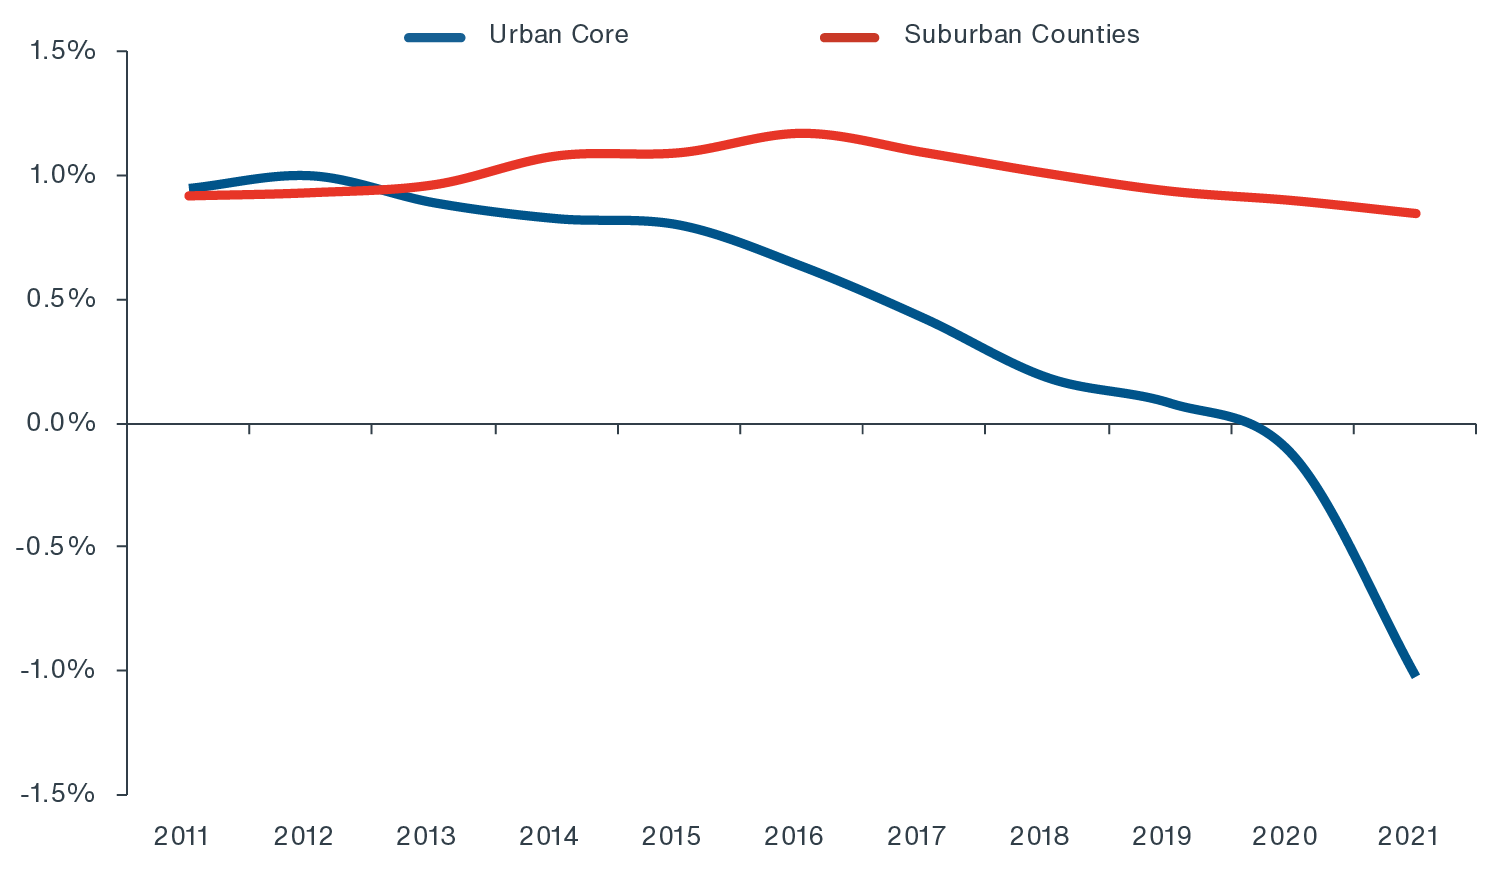
Sources: 1) Brookings, April 2022. 2) CBRE-EA, Q1 2022. Note: Based on metropolitan areas exceeding 1 million in population.
FIGURE 6: URBAN CORE LOST PEOPLE IN 2021, WHILE OUTLYING AREAS GAINED:
POPULATION GROWTH BY COUNTY
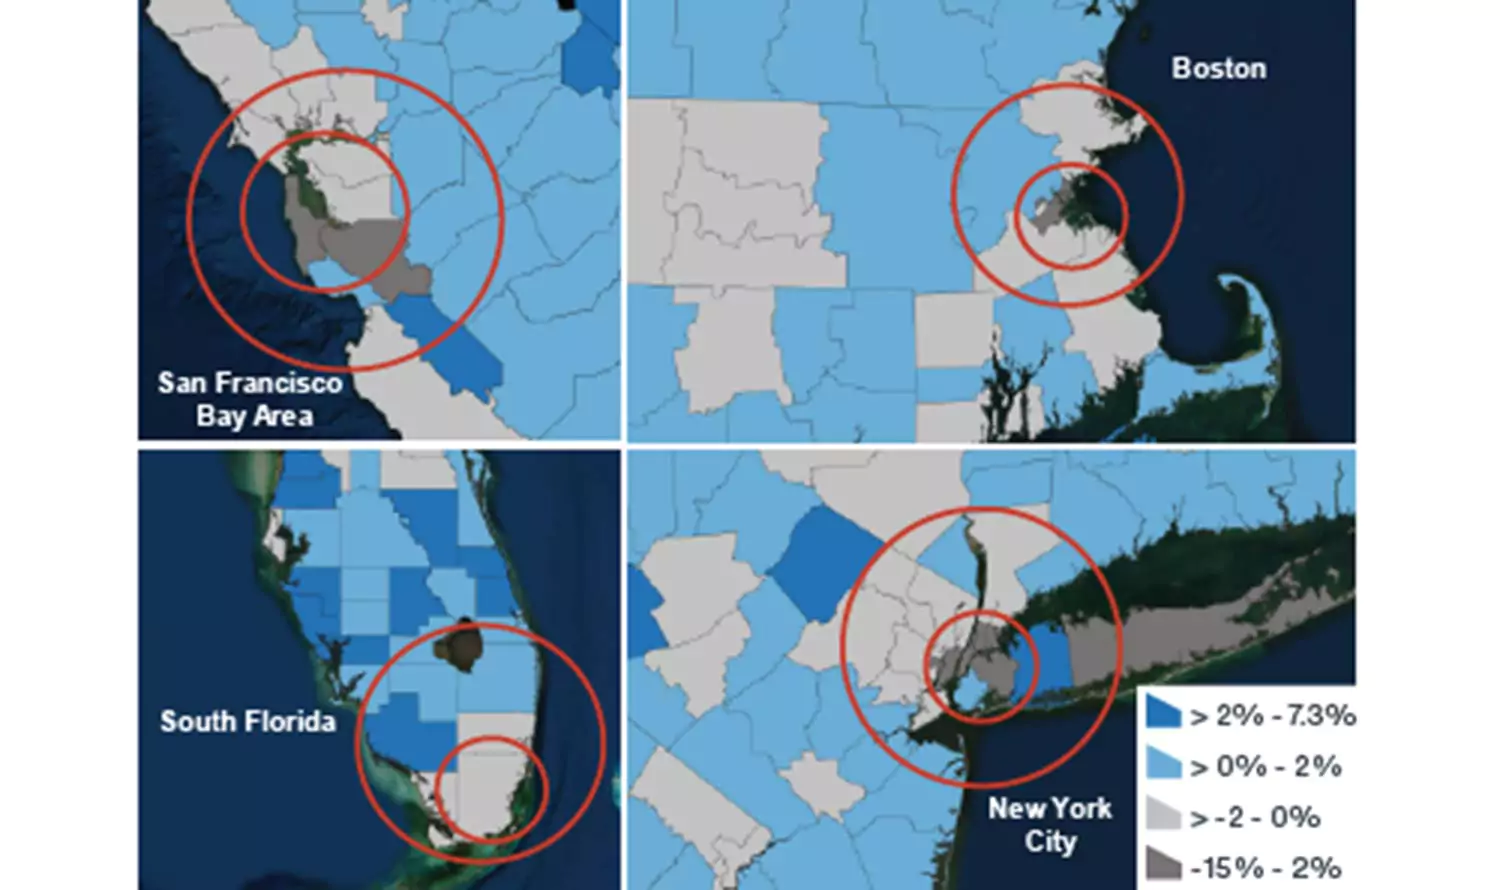
Source: U.S. Census Bureau, Clarion Partners Investment Research, Q1 2022.
WILL CBDs MAKE A COMEBACK?
At the same time, Clarion Partners remains optimistic about the future vibrancy of the CBDs (central business districts) of the largest U.S. employment hubs. Many large cities like San Francisco, San Jose, Seattle, and Boston still report the highest-shares of high-paying jobs, as well as high value-add industries. However, competitive salaries have become more common in Sun Belt cities like Austin, Dallas, Nashville, and Jacksonville over the past two years. New and existing high-paying job clusters have broadreaching and positive effects on local economies.
Recent data shows there has been a robust inflow of young workers into CBDs across the country. Therefore, we are optimistic about the future resilience of many large cities as many in Gen Z, a generation of over 80 million people, now enter the workforce and seeks traditional urban living arrangements.7 Additionally, almost a third of Millennials are still under age 30.
While we believe that hybrid work arrangements are likely to stay, the recent migration patterns might be partially revised if return-to-office (RTO) gains momentum.8 Current U.S. physical office occupancy levels are still on average 50% below pre-COVID levels.9 Such uncertainty will likely impact the pace of recovery in large CBDs across the country.
ACCELERATED MIGRATION DRIVES REAL ESTATE RETURNS
Clarion Partners believes that CRE investors should prepare investment strategies expecting more de-densification in the future. Recent NCREIF Property Index (NPI) returns have also indicated strong outperformance in multifamily returns in the Mountain, Southeast, and Southwest regions, along with the two lower-density multifamily formats (i.e. garden-style and low-rise apartments)
(Figure 7). Both suburban office and community/ neighborhood retail returns, in particular in the Sun Belt, have also been robust in recent years. We expect that strong economic, demographic, and affordability tailwinds will continue to drive robust demand in these regions and subtypes.
- Anticipated job growth through 2030 is expected to be greatest in various Texas and Florida markets.10 Corporate relocations to business-friendly states continue to be announced.
- Year-to-date in 2022, new driver’s license issuance data also shows that migration from New York to Florida has accelerated, which is over 50% higher than the first four months of the last pre-pandemic year of 2019.11
FIGURE 7: MULTIFAMILY 1-YEAR NCREIF PROPERTY INDEX RETURNS BY REGION & SUBTYPE
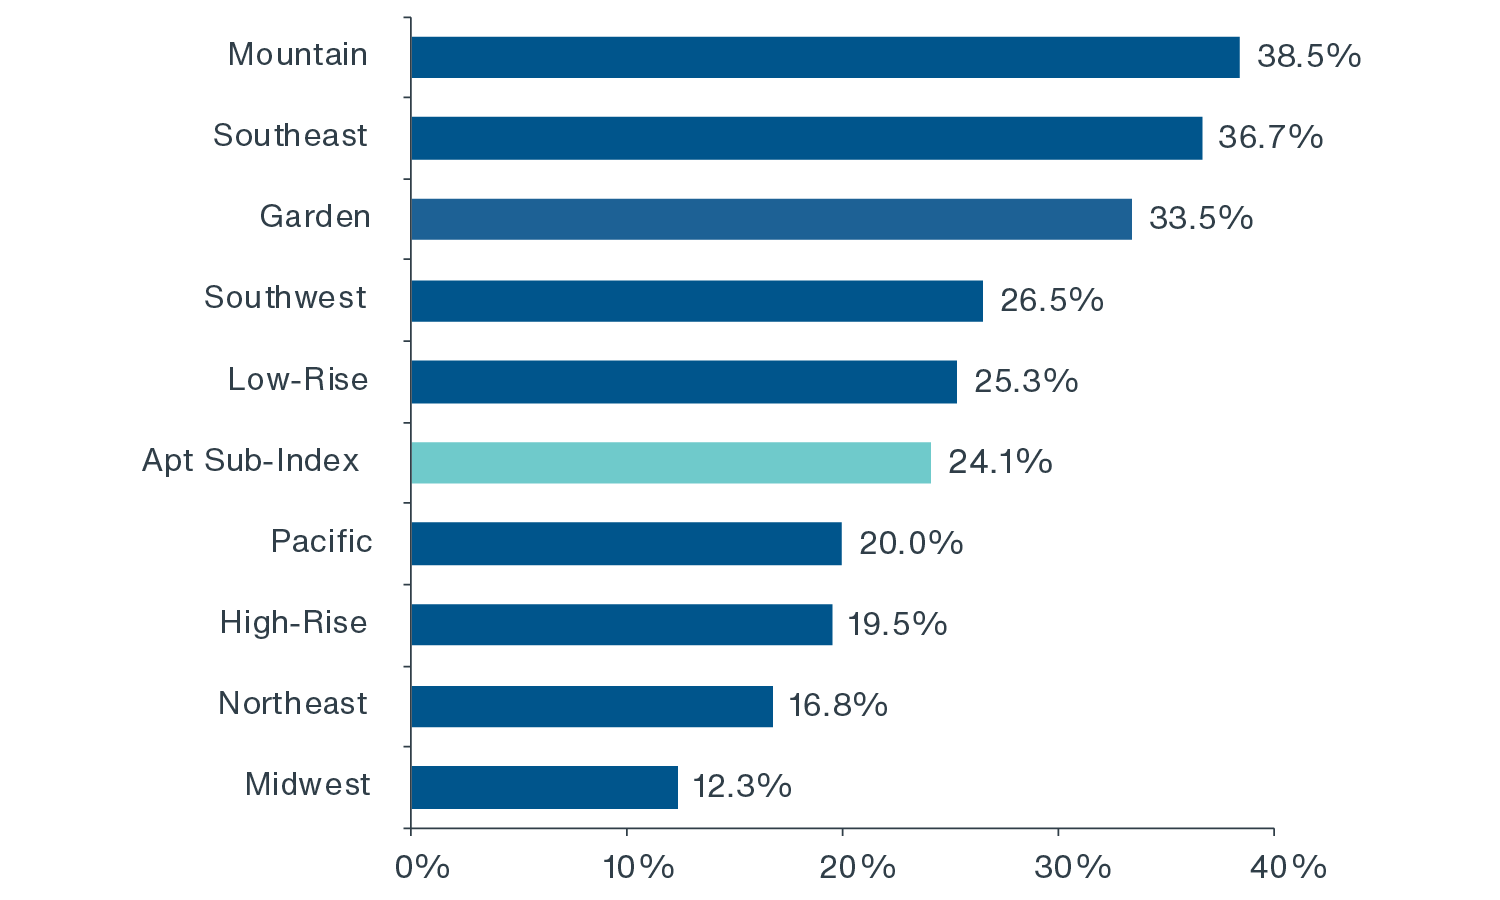
Source: U.S. Census Bureau, Clarion Partners Investment Research, Q1 2022.
CONCLUSION
The recent U.S. migration trends began well before the onset of the pandemic, however, accelerated across many areas during 2020 and 2021. The pandemic was certainly a key factor in the recent shift away from high-cost, densely populated, large U.S. metros, however, robust growth in the Sun Belt, Mountain region, and suburban/exurban areas has been well-underway for many years and is likely to continue in the years ahead.
Clarion Partners believes that strategic CRE capital allocators should increasingly focus on high-growth locations with thriving industries, steady in-migration, and pro-business policies for greater return potential. Prudent real estate investing may depend more than ever before on understanding where Americans want and are able to live, work, and play postpandemic. The following factors escalated the recent shifts and will likely continue to drive migration in the future:
- Acute affordability issues in many large U.S. metros;
- Lower taxes/business-friendly environment;
- Potentially more hybrid/remote work;
- Rising urban crime;
- A warmer climate;
- Aging Millennials;
- And the Baby Boomer retirement boom.