The global uncertainty created by U.S. tariff policy has unsettled financial markets and has cast a shadow on economic growth prospects. While the situation remains fluid with many moving parts, we believe that a corner of stability may be found in European commercial real estate, which has significantly repriced since market peaks in 2022, and where market fundamentals remain solid and macro–drivers broadly supportive. Defensive, income-oriented strategies – such as European Net Lease – can be especially interesting for non–European investors seeking stability, yield, and geographic diversification. This report sets out the rationale for that conviction.
WHY EUROPE? ATTRACTIVELY PRICED AND FUNDAMENTALLY SOUND
Since mid–2022, private European commercial real estate (CRE) has experienced a significant repricing. Capital values have recently stabilised, and total quarterly returns have been positive over the past year (Figure 1), suggesting a potentially attractive entry point into the next cycle. Importantly, the delta between appraisal and market cap rates in Europe is minimal relative to the U.S.1 Moreover, European CRE currently compares favourably to other asset classes that have already recovered in value more rapidly (Figure 2). Finally, while developed CRE markets have historically shown high correlation, the diversification benefits offered by European CRE (Figure 3) are likely to become increasingly attractive amid shifting globalisation dynamics and growing policy divergence.
FIGURE 1: INREV FUND-LEVEL RETURN
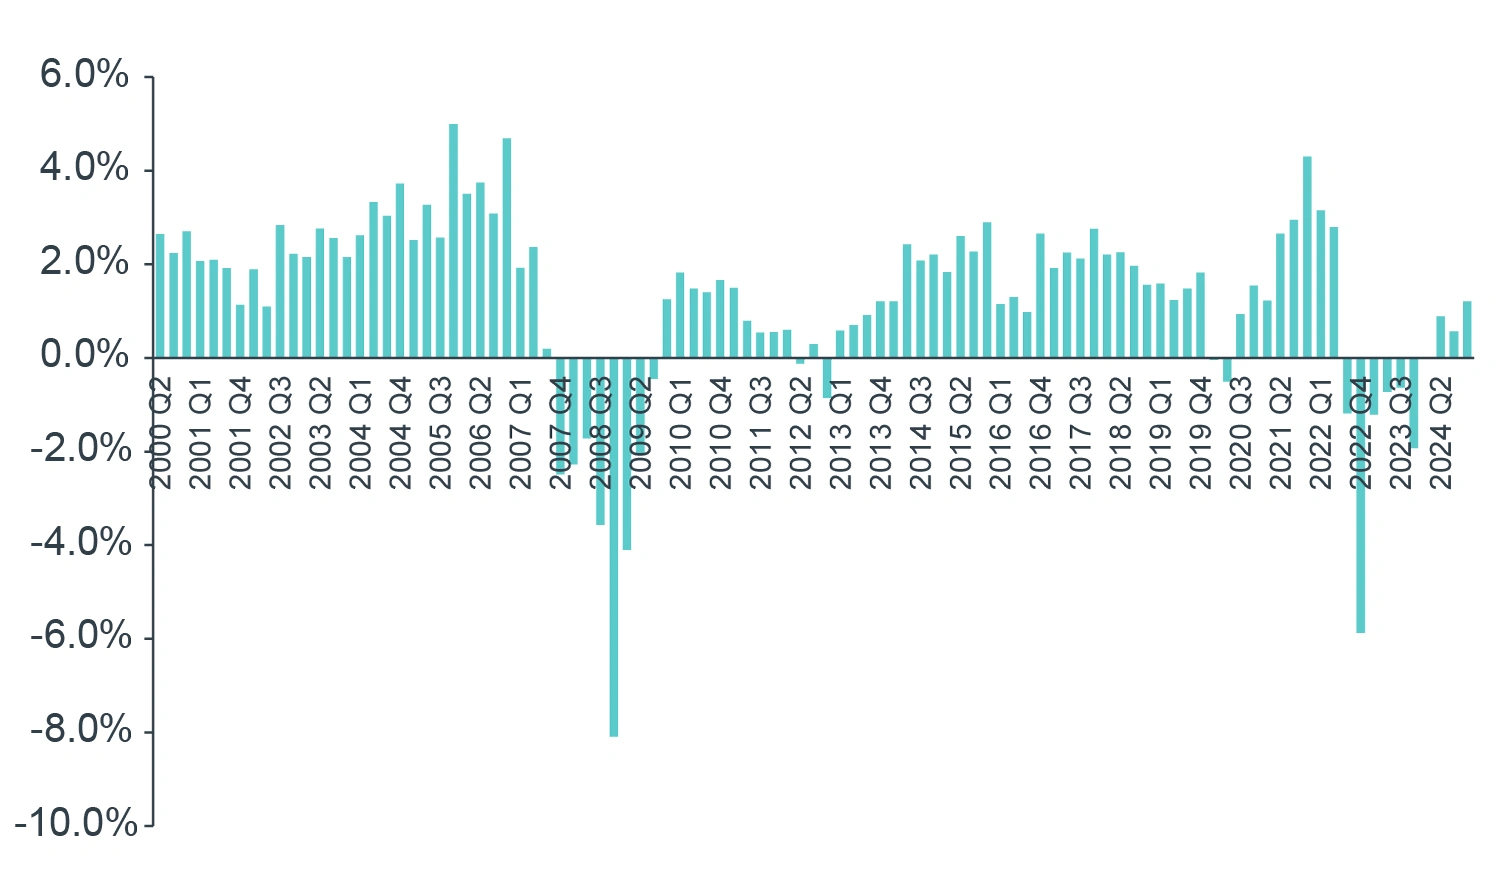
Source: INREV, Clarion Partners Global Research, Q4 2024.
FIGURE 2: RELATIVE VALUATIONS OVER 10-YEAR PRIOR
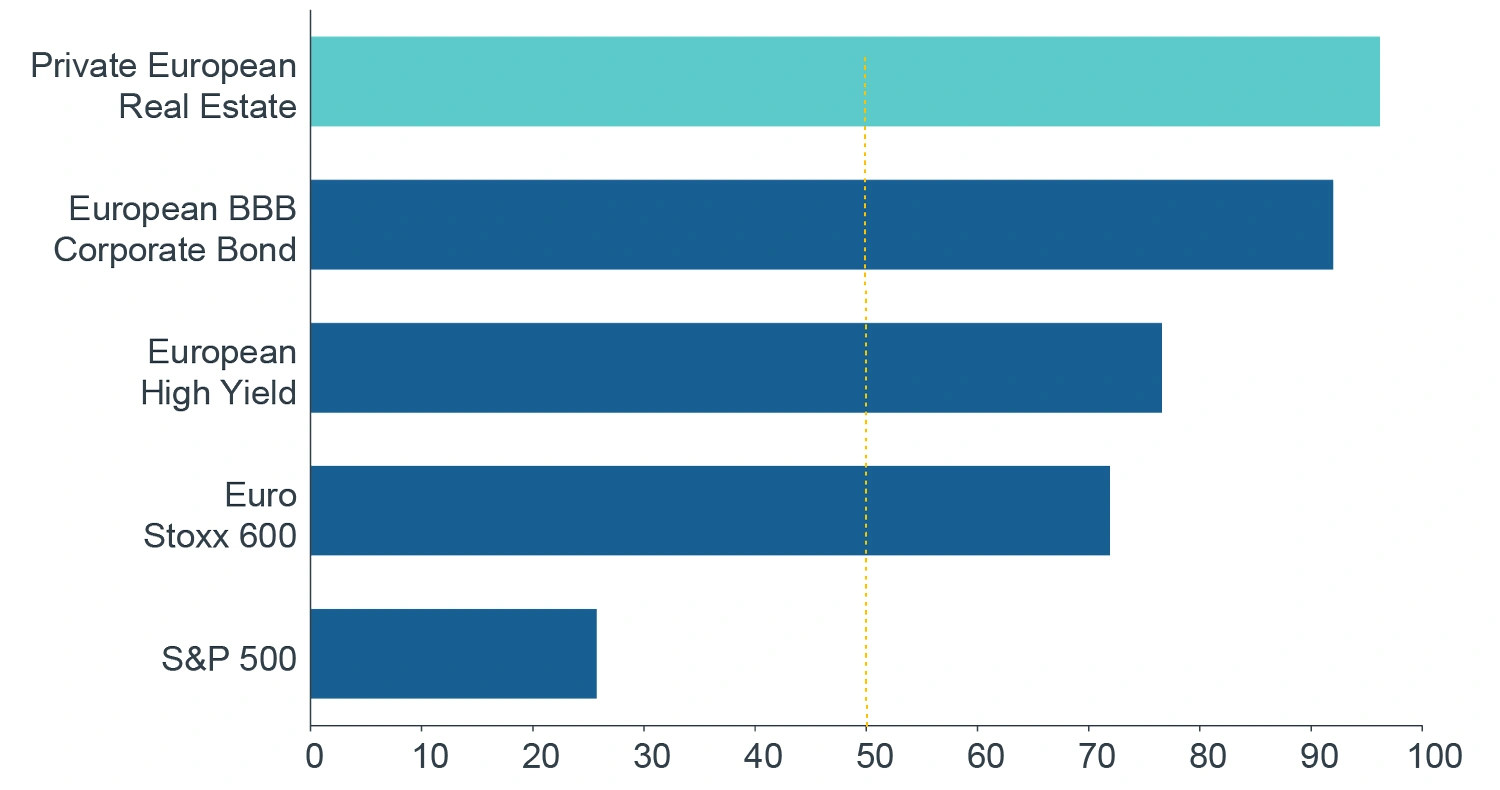
Source: Bloomberg, Green Street, Clarion Partners Global Research, Q1 2025. Note: Graph shows normalised Z scores of following valuation metrics: Private European Real Estate: prime yield; European BBB bonds: yield-to-convention;European HY bonds: yield-to-maturity, REITs: implied economic cap rate, unweighted average of office, retail and industrial; S&P500 and Eurostoxx 600: P/E Ratio. The asset classes are associated with different levels of volatility, liquidity and other risks.
FIGURE 3: CORRELATION ANALYSIS (Q1 2005 - Q4 2024)
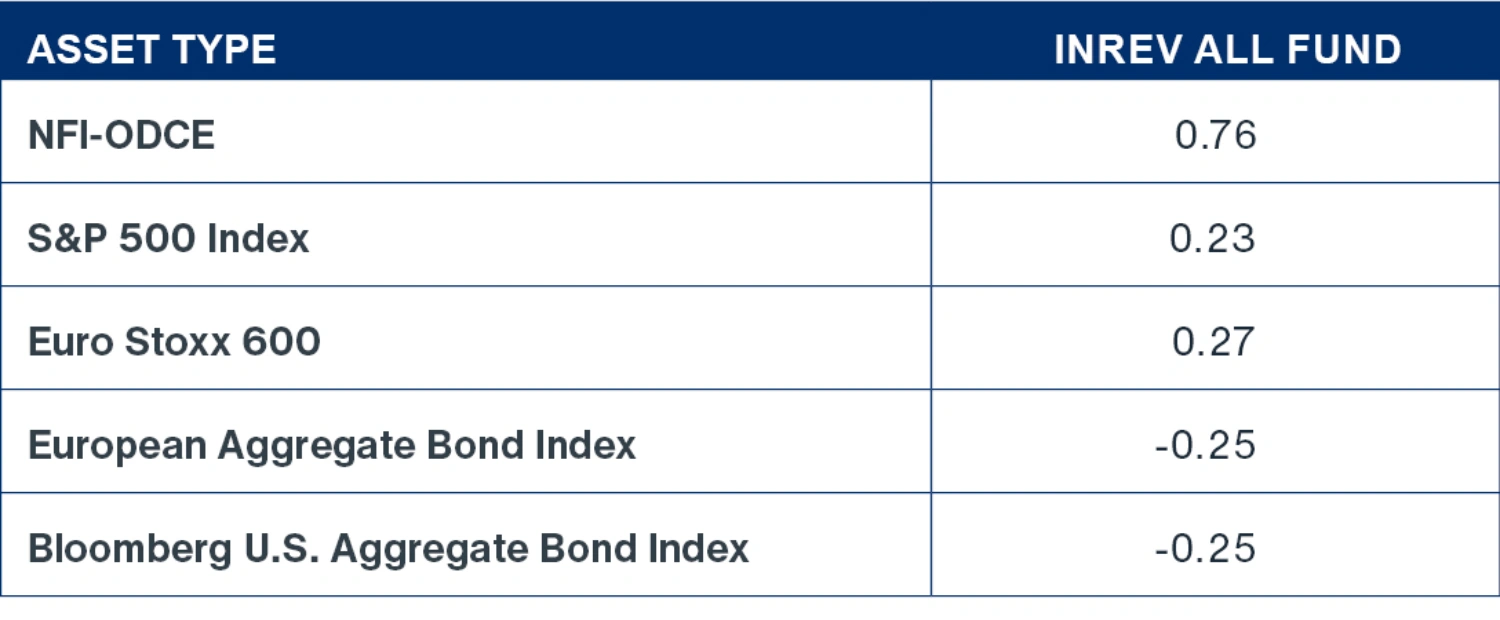
Source: INREV, NCREIF, Bloomberg, Clarion Partners Global Research, May 2025.
Despite global uncertainties, Europe’s macroeconomic environment is broadly positive. Inflation in the Eurozone has moderated and is now hovering around the European Central Bank’s (ECB) 2% target. This creates potential for a more accommodative interest rate and monetary policy stance, which should act as a tailwind for CRE valuations and transaction activity. Market fundamentals remain generally robust across sectors, with vacancy rates relatively low in key sectors, such as logistics, which have seen a relatively less pronounced development cycle (compared to the U.S. markets, for example).
WHY EUROPEAN NET LEASE?
Within the broader European CRE landscape, we believe that Net Lease strategies warrant serious consideration. At this stage in the cycle, their appeal lies in a defensive profile – where returns are driven primarily by secured contractual income and lease indexation – rather than relying on less certain assumptions around market rent growth or exit yields. Historically, European Net Lease has outperformed broader market benchmarks during periods of macroeconomic uncertainty, as investors have placed a premium on long–duration, stable cash flows.2 Furthermore, we see four key advantages of European Net Lease – particularly when compared to equivalent U.S. strategies:
Attractive Day 1 Yield Spread: Following interest rate repricing, European Net Lease now offers an appealing Day One yield spread over the cost of debt (Figure 4). This compares favourably to the U.S., where it is not uncommon for new acquisitions to be cashflow-negative in early years due to higher debt costs. More broadly, European CRE also seems to trade at a relatively attractive spread to fixed-income alternatives in historical context (Figure 5).
FIGURE 4: TYPICAL RANGE OF EUROPEAN NET LEASE NET INITIAL YIELD VS. COST OF DEBT
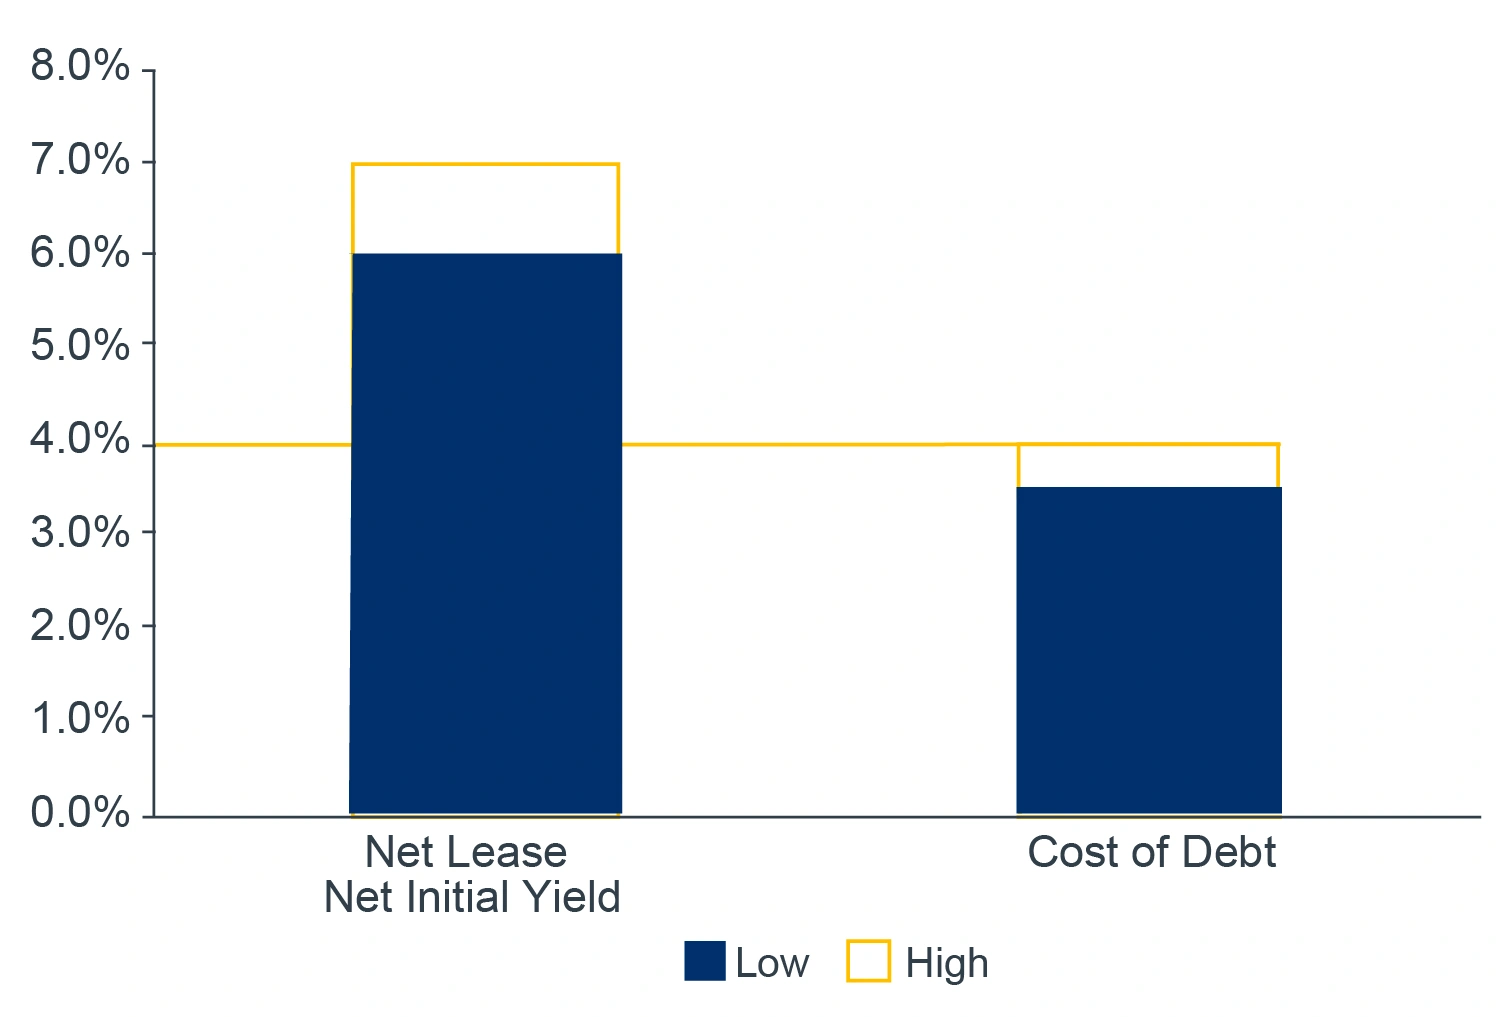
Source: Clarion Partners Global Research, May 2025. Note: yield range reflects transactions underwritten by Clarion Partners Europe.
FIGURE 5: EUROPEAN CRE CAP RATE SPREAD VS. INVESTMENT GRADE
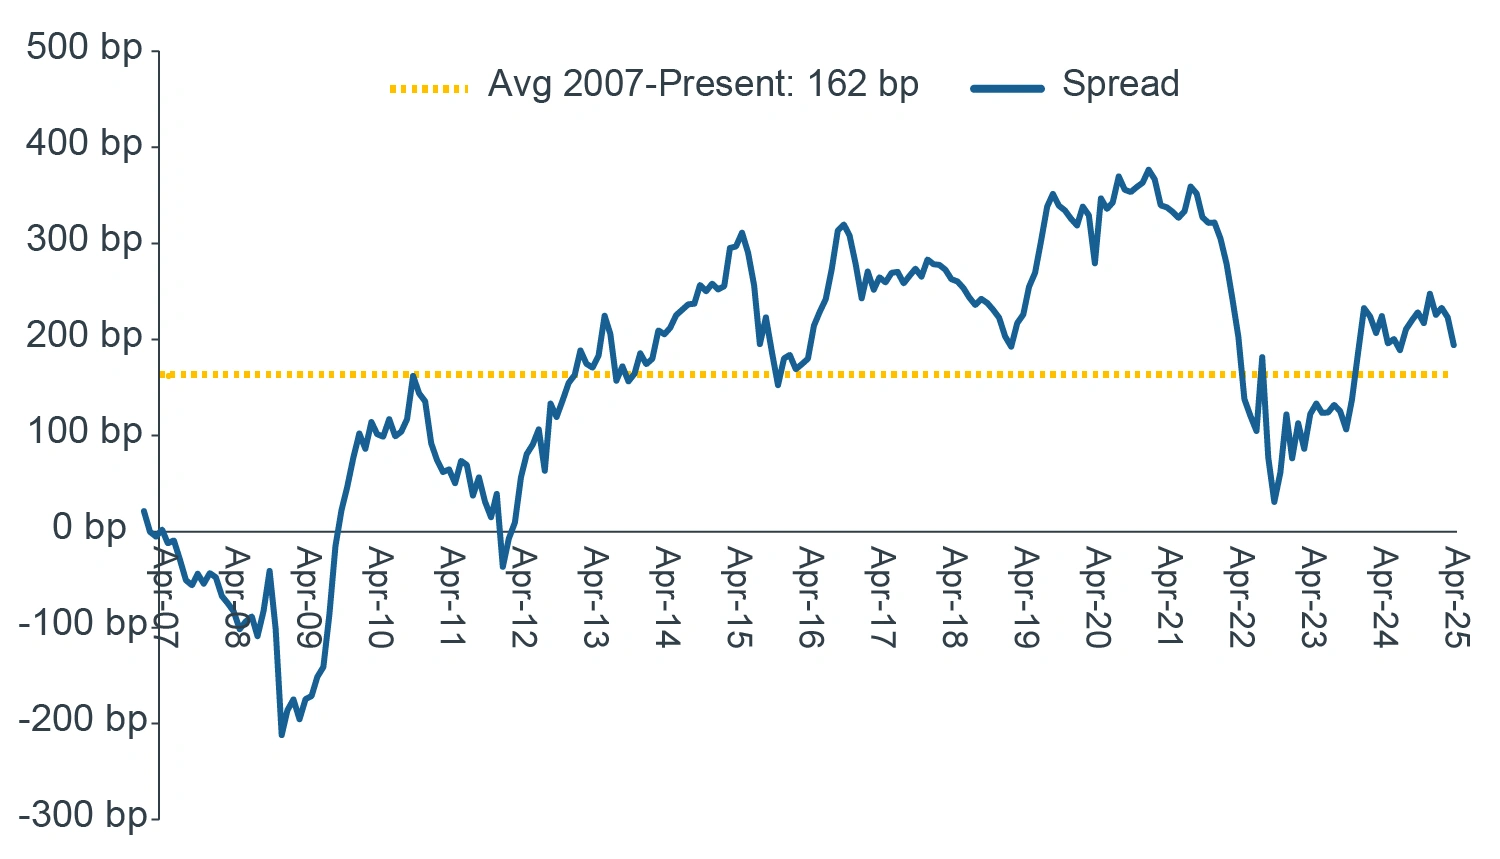
Source: Green Street, Clarion Partners Global Research, May 2025.
Inflation Linked-Cashflows: A significant differentiator specifically for European real estate as compared to U.S. is the indexation of rental income to inflation, either capped or uncapped. This feature provides a built-in hedge against inflation and contributes to capital value preservation through indexed growth. By contrast, U.S. leases more commonly include fixed uplifts that may lag behind actual inflation. Over the last five years (2020-2024), European Net Lease income grew on average by 4.5% per annum, versus just 0.1% in the U.S.3
Market Inefficiency Premium: European Net Lease – proxied by corporate disposals – has averaged over €20bn per annum in transactions over the last 10 years.4 We think the addressable market is vast given relatively high ownership rates in Europe (~65%).5 While expanding, the European Net Lease market remains relatively opaque, with many transactions occurring off–market via direct negotiation or corporate finance routes. Although this can pose a barrier to entry, it also creates opportunities for specialist managers with strong local networks to exploit inefficiencies, uncover hidden value, and generate superior risk–adjusted returns.
Limited Capital Competition: A corollary of the previous point is the relatively limited capital competition in the European Net Lease market. One indicator of this is the number of specialist REITs operating in the space – just three in Europe6 compared to 17 in the U.S.7 – as well as their comparatively short trading histories. Many Net Lease/long-income investors are UK–based and typically target a core return profile. There is generally a lack of pan–European platforms pursuing higher–yield strategies. This capital demand-supply imbalance is a compelling feature of the European Net Lease market which allows investors to lock in potentially attractive yields on acquisition.
CONCLUSIONS
European Net Lease presents a compelling investment case for global investors seeking secure, inflation–resilient income in today’s fragmented and shifting macroeconomic landscape. With favourable yield spreads, structurally sound fundamentals, and inflation–linked rental streams, the strategy combines downside protection with long–term upside potential. While European Net Lease market complexity requires specialist expertise, it also creates inefficiencies from which well-positioned investors can benefit. In a world of growing divergence, European Net Lease offers a strong risk–adjusted investment opportunity for global real estate capital allocation.