RAPID RISE IN INSTITUTIONAL INVESTOR ALLOCATIONS
The industrial sector has become a global favorite amongst institutional investors as large structural shifts already underway, accelerated during the pandemic. The increasing adoption of e-commerce, driven by demographic shifts, technology, and shifting global trade dynamics, has remained a steadfast driver of industrial demand and led to a higher share of institutional investor allocations to the sector (Figure 1). Notwithstanding some near-term challenges and regional differences, Clarion Partners believes industrial real estate will remain a compelling long-term investment opportunity across the EU and the U.S.
FIGURE 1: U.S. & EU INDUSTRIAL TRANSACTION VOLUME HISTORY ($ BILLIONS)
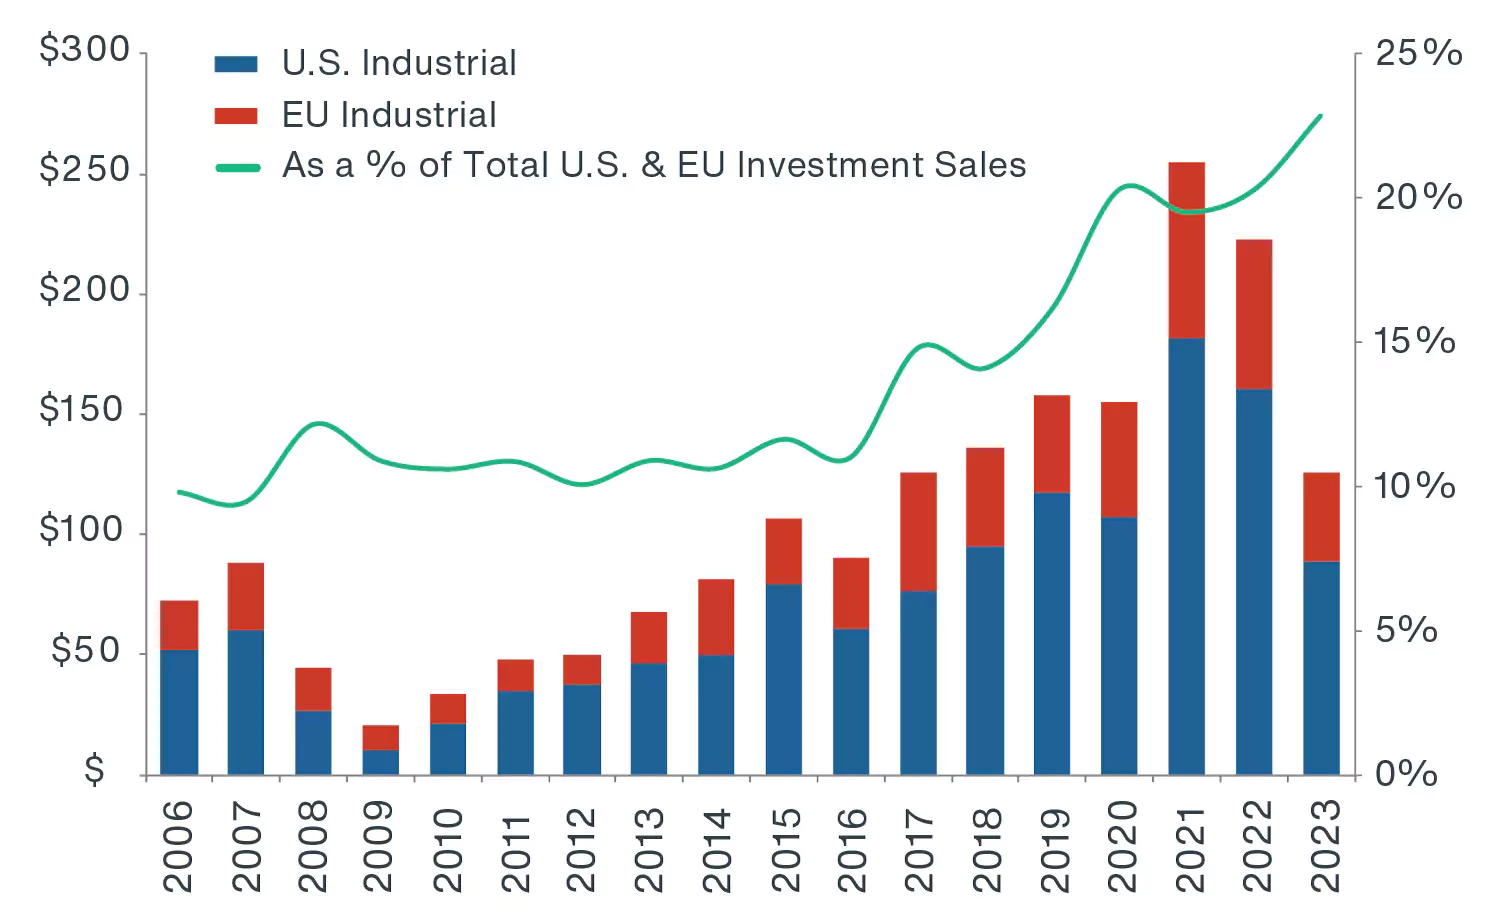
Source: Real Capital Analytics, Clarion Partners Investment Research. February 2024.
INDUSTRIAL A TOP PERFORMING SECTOR AIDED BY STRONG DEMAND
Industrial property has continued to be the best performing commercial real estate sector in the U.S. and EU. In recent years, it has outperformed the benchmark and other property types on the back of rising rents and record low vacancy levels (Figure 2). Over the past decade, rent levels have continued to reach all-time highs in both the U.S. and EU, well exceeding the four-core sector average and inflation.1 At 2023 year-end, U.S. and EU industrial vacancy levels were still near the lowest point on record at 4.9% and 4.0% (compared to long-term averages of 6.7% and 4.9%%, respectively). Most of the top distribution hubs report vacancy levels well below long-term averages.2
In 2024, we expect new demand to moderate as markets absorb elevated levels of new supply. The short-term weakness is not altogether unexpected given the record level of new supply after developers raced to meet surging demand following the onset of the COVID-19 pandemic. U.S. and EU industrial net absorption continued to well outpace new supply and reach record levels in 2021 and 2022; however, leasing moderated in 2023 in many top markets amidst a wave of completions largely concentrated in a few high growth distribution hubs. Going forward, new construction is expected to tail off from 2024 and 2025, as the high cost of debt has made development IRRs more challenging.
FIGURE 2: U.S. & EU INDUSTRIAL INVESTMENT PERFORMANCE (3-YEAR VS. 5-YEAR)
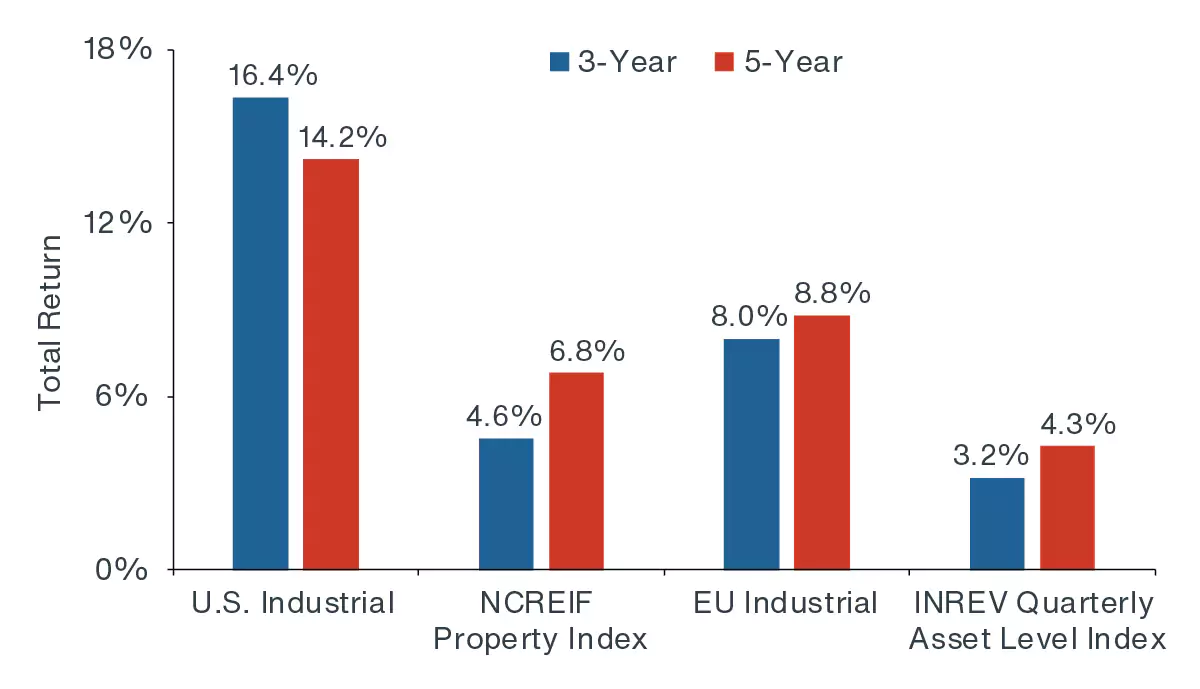
Source: NCREIF, INREV, Clarion Partners Investment Research, February
2024. Note: INREV data as of Q3 2024.INREV data as of Q3 2024. NCREIF
data as of Q4 2023. Both represent total unlevered returns.
CHANGES IN DEMOGRAPHIC PROFILES ARE DRIVING CONSUMPTION & E-COMMERCE
One of the most profound changes in the global economy is the ongoing shift in demographics and innovation that is tilting the shape and form of consumption. Innovation and technology have enabled e-commerce to grow rapidly and become an integral part of how societies consume. Each age cohort has different consumption needs which are being met by e-commerce fueled by logistics and warehouses. This significant structural change in consumption behavior was materially boosted by the COVID-19 pandemic pushing more people towards the safety of e-commerce transactions. Industrial and logistics assets, which provided the critical infrastructure for this growth, saw occupier demand surge. As the Millennial and Gen Z cohorts enter peak spending years, their comfort and ease with technology remains a lynchpin for industrial demand going forward.
E-commerce will remain a material driver of the industrial sector; however, e-penetration rates and mobile shopping trends vary by region. For example, in the U.S., online sales as a percent of core retail sales are currently about 20%, while throughout the EU the e-penetration rate varies by country, ranging from 9% to 27%.3 This would suggest a differentiated path for e-commerce penetration in the years ahead with some markets offering a substantial runway. Both geographies anticipate e-commerce growth of 5% to 10% annually in the years ahead.4
SHIFTING GLOBALISATION & SUPPLY CHAIN DIVERSIFICATION PATTERNS ARE POSITIVELY IMPACTING LOGISTICS DEMAND
For over four decades, the world economy has benefitted from ever increasing globalisation and the increase in trade that has accompanied it. The industrial and logistics sector has been a direct beneficiary. In recent years, geopolitical tensions have threatened established supply chains; consequently, an increasing number of countries are focused on strengthening local production and distribution, as well as diversifying trade partners to create a more resilient network.
Nearshoring/Onshoring Growth. As part of shifting trade patterns, U.S. trade levels with Mexico, Canada, & Southeast Asia have risen rapidly in recent years. As a share of U.S. imports of goods in dollars, these countries are the fastest growing, while China’s share declined from 22% to 14% from 2017 to 2023.5 This diversification in trading partners should benefit demand in U.S. border industrial markets in Texas, Arizona, and California. The greater L.A. metro, Dallas - Fort Worth, and Phoenix remain top destinations for goods crossing the southern border.6 While L.A. will remain a key point of entry because of its unparalleled infrastructure and large regional population base, supply chain shifts imply a broader use of multiple coasts, ports, trade modes, and routes. Forecasts indicate that global trade levels will continue to rise and drive ongoing warehouse demand. All else being equal, a 1% rise in U.S. imports is associated with an approximate 5% rise in net absorption.7
Domestic manufacturing boom. At the same time, U.S. government and corporations are investing heavily in more domestic production. Over the past 30 years, China quickly emerged as the preeminent global manufacturing hub, producing almost 20% of global manufacturing output, a three-fold jump from 2005.8 As part of its plan to reduce U.S. manufacturing dependence on China, particularly in high-tech, high-value industries, the White House continues to advocate for increased on- and near-shoring. Recent estimates suggest that U.S. companies have so far announced $642 billion in commitments towards onshoring projects involving heavy industry, semiconductors, energy, electric vehicles, and biomanufacturing.9 We anticipate that future manufacturing space demand could be up to 75 million SF nationally.10 A similar trend is occurring throughout the EU, where several large-scale manufacturing investments have been announced in strategic industries similar to those in the U.S.
The European Council’s European Chips Act in 2023 seeks to mobilize billions of euros in public and private investment with the objective of doubling the EU’s global market share in semiconductors, from 10% now to at least 20% by 2030.11 Furthermore, a recent survey indicates that 50% of the occupiers surveyed agree or strongly agree that reshoring of production/assembly activities from China/Asia to Europe will increase substantially in the next three years.12 Low-cost manufacturing and labor markets in Eastern Europe are generally considered to be the most attractive for onshoring/nearshoring to serve the European market. Savills estimates that if the EU successfully hits this target, we can expect to see up to 116 million SF of additional logistics demand by 2030.
RESILIENCY & THE NEED FOR NEW STOCK AS OBSOLECENCE GROWS
Sustainability mandates drive demand for newer, more resilient assets. A growing set of regulations and demand from tenants is pushing investors towards more sustainable assets. Currently, U.S. industrial stock built before 2000 accounts for about 70% of total inventory.13 Over the next five years, approximately 10% of existing warehouse stock will reach or surpass the obsolescence threshold.14 In the UK, it is estimated that over 75% of stock was built before 2010.15 In the years ahead, much of the existing inventory will require replacement and/or modernisation to serve newer innovative technologies as well as sustainability mandates. New facilities are usually built to the latest energy codes, which tend to optimise energy efficiency, improve net operating income, and boost asset values. Some of the latest technologies industrial assets are deploying include sky lights and energy efficient lighting, water conservation measures, solar power capture and storage, and EV charging infrastructure.
Europe is leading the U.S. on the ESG adoption and implementation front, with many European countries phasing in more stringent minimum energy standard regulations and reporting standards. The Global Real Estate Sustainability Benchmark (GRESB) is an industry-led organisation providing standardised and validated ESG data for the real estate industry now required by financial regulations. In 2023, ESG fund participation rose to the highest level on record; however, it has continued to vary considerably by country. Out of the 2,084 funds tracked, 1,013 are in Europe, and 555 are in the Americas.16 Europe recorded the highest number of new participants last year; although, there was still steady growth within the U.S.
PLENTY OF INVESTMENT OPPORTUNITIES BUT SOME NUANCED DIFFERENCES BETWEEN THE U.S. AND EU
The strength of structural demand will continue to support the industrial sector but nuances between the U.S. and Europe suggest slightly different investment opportunities. Although the EU’s population (448 million) is larger than that of the U.S. (335 million), the industrial landscape is very different. The U.S. is far more developed in terms of industrial stock at 16.1 billion SF, while the largest EU markets have 4.0 billion SF.17 Over the short term, the U.S. is also facing a more substantial supply response, while the EU is generally more supply constrained. Moreover, price discovery has progressed faster in the EU allowing a faster reset of values, which is supportive of in-place acquisitions. Differences notwithstanding, both markets have the need for modern logistics stock that can cater to the growing structural demands. In particular, we believe that investors should focus on:
Class A stock product. Class A warehouse assets tend to be newer, more modern buildings that better service the automation and high throughput requirements of e-fulfillment. Currently, this segment makes up for only 18% of the U.S. industrial market (2.9 out of the entire 16.1 billion SF) but has accounted for 50% of net absorption since 2018.18 The need for Class A facilities in the U.S remains substantial.19 Rent growth for modern logistics properties has also outperformed significantly. Over the past three years, the post-2000 vintage building set reported an average rent growth of 23% against 11% for the pre-2000 building group.20
Last-mile delivery assets. There continues to be extraordinary demand for same- and one-day delivery. Amazon is now actively leasing under its “regionalisation” strategy, which intends to double its number of same-or next-day delivery centers in the coming years. “Light industrial” assets, which tend to be under 400,000 SF, typically serve last-mile distribution, and on average command higher rents than bigbox and normally account for the large share of overall annual industrial absorption.21 This trend is less developed in the EU and has the potential to change in the years ahead.
Overall risks in both the U.S. and EU regions include slower economic growth, an elevated new construction pipeline through 2024, higher interest rates, and more muted demand relative to recent years. Although we recommend being selective by market and asset, debt capital is generally widely available for high-quality and strategically located logistics product.
THE OUTLOOK REMAINS BRIGHT
Heading into 2024, the U.S. and EU economies have remained resilient despite tighter monetary conditions and heightened geopolitical uncertainties. As the prospects for further rate hikes and recession risks fade, we expect asset values to trough and debt capital costs to improve thereby, providing the industrial sector tailwinds as it enters a new cycle.
Powerful and durable structural themes give us confidence in the industrial sector. Notwithstanding some short-term supply issues in the U.S. and deeper market losses in the EU, we expect the continued strength in demand to lead the industrial sector to deliver the best rent growth over the forecast period among the big “four” property types (Figure 3).
FIGURE 3: U.S. VS. EU RENT GROWTH FORECAST AVERAGE BY SECTOR (2024F-2027F)
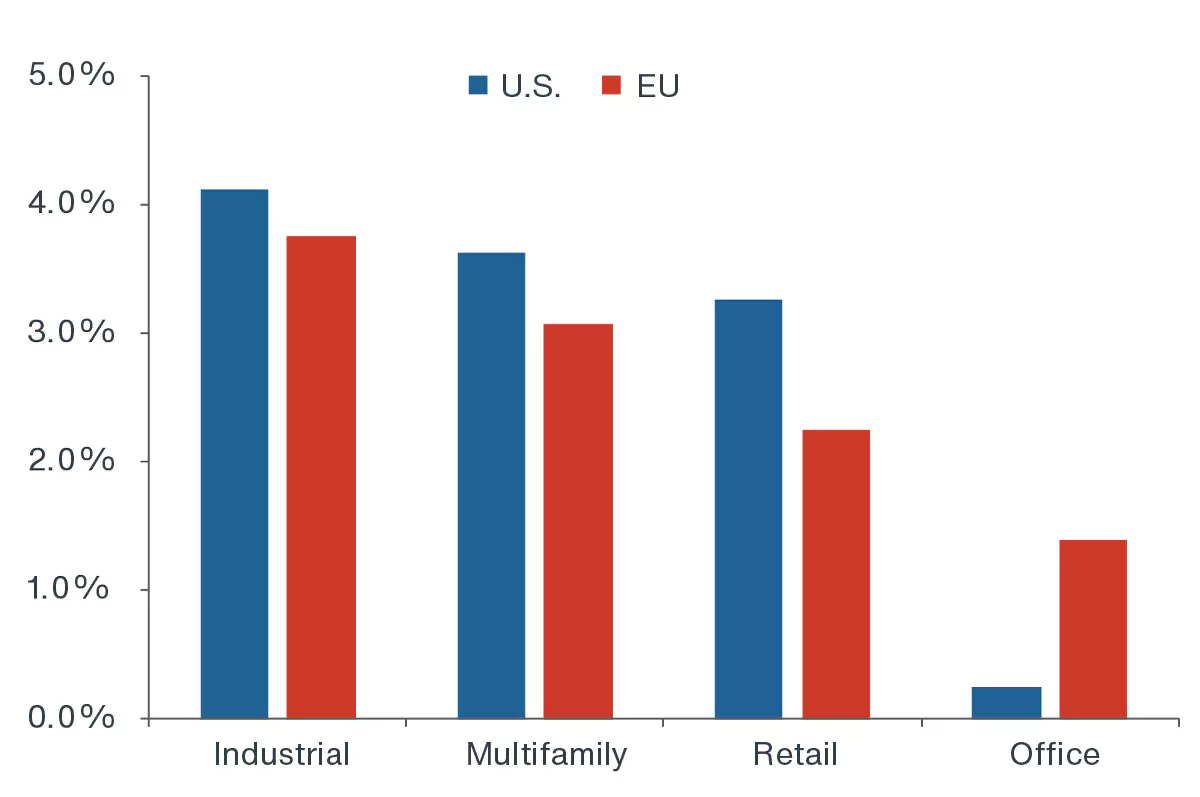
Source: Green Street Advisors, Clarion Partners Investment Research, February 2024. Note: U.S based on internal forecast, while EU based on Green Street Advisors headline rent growth forecasts using an aggregate of the top EU 30 markets.