INTRODUCTION
Over the past decade, U.S. multifamily has been among the most sought-after sectors by institutional investors due to its necessity characteristic, the underlying strength of property-level fundamentals, and high historic risk-adjusted total returns. It has remained an integral part of commercial real estate (CRE) investment portfolios with a portfolio weighting of 29.1% in the NCREIF Fund Index-Open End Diversified Core Equity (NFI-ODCE).1 Clarion Partners believes that well-located, high-quality rental housing will continue to be a strong performer over the long term due to a variety of macro, demographic, and financial factors.
MACRO DRIVERS SUSTAINING RENTAL HOUSING DEMAND
Clarion Partners is optimistic about the outlook for U.S. multifamily from 2024 to 2028 and beyond primarily due to two macroeconomic factors:
- The National Housing Shortage. Following a decade of underbuilding, there continues to be a national housing shortage. Both the U.S. for-sale housing inventory and the rental housing vacancy rate have remained very low in many markets in recent years (Figure 1). Clarion Partners estimates a total current shortfall of 2.8 million housing units. Broken down by tenure, a shortfall of 1.3 million for-sale units and 1.5 million for-rent units.2 This view is consistent with other industry estimates of the U.S. housing shortage that generally range between 2 and 5 million units depending on the methodology.3
This shortfall is expected to grow as disruptions in the
capital markets are leading to fewer multifamily starts, and demographic trends support continued demand. The deficit is even more pronounced in the low and middle price point market, as much of the new construction targets the high-end segment.
Over the next decade, John Burns Research & Consulting estimates total new U.S. housing demand will be 18.6 million new homes, 1.9 million per year, inclusive of for-sale and for rent housing.4
FIGURE 1: LOW AVAILABILITY IN ALL FORMS OF HOUSING
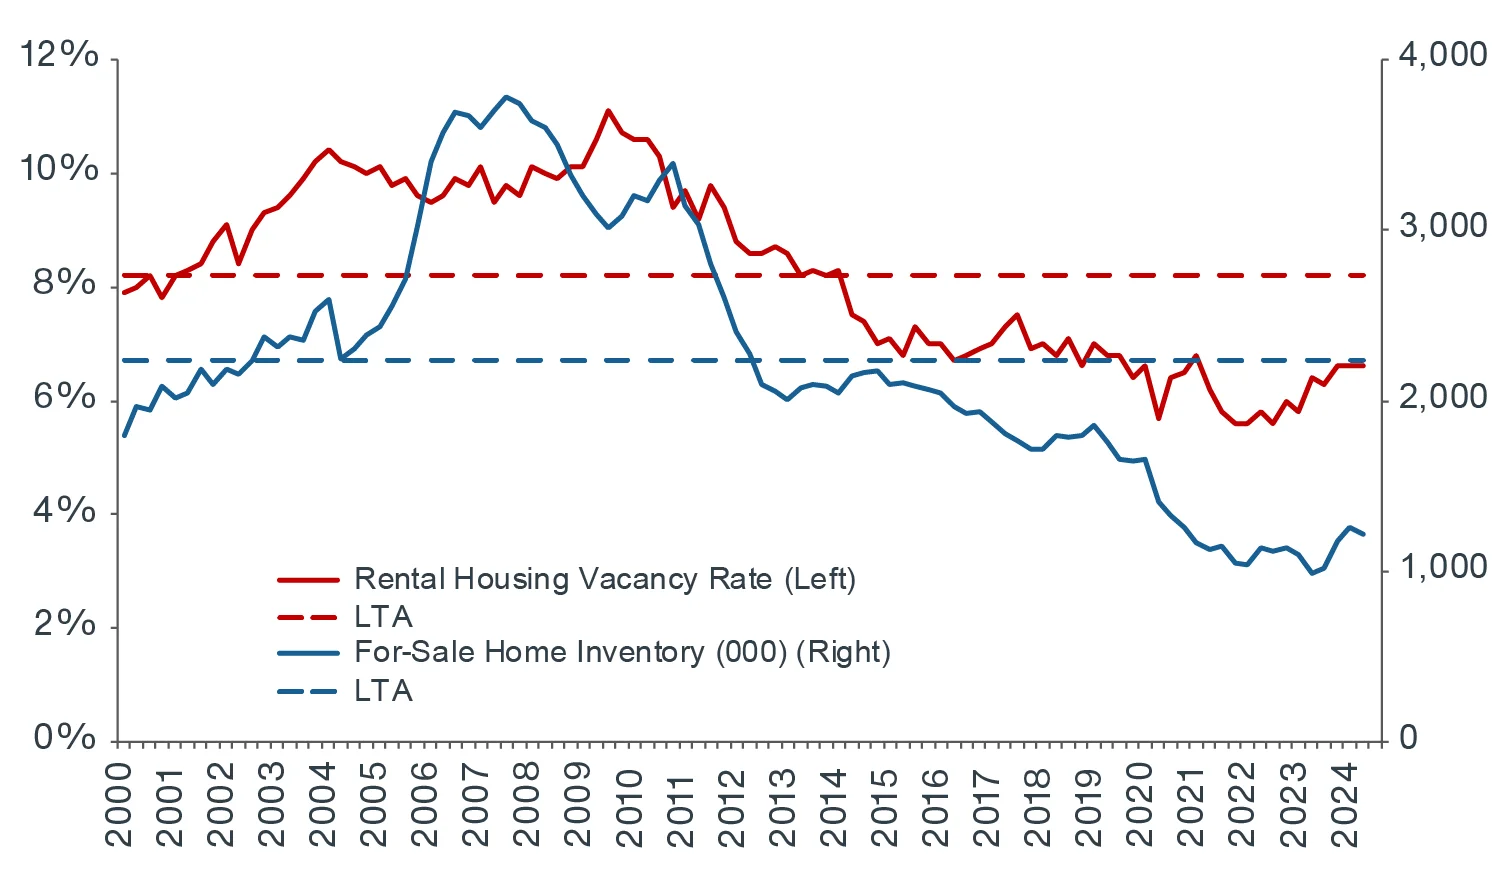
Source: U.S. Census Bureau, Moody’s Analytics, Clarion Partners Investment Research, Q2 2024. Note: Rental housing includes non-institutional and institutional-quality multifamily and single-family rental houses.
- Favorable Demographics: Robust Renter Base in All Generations. The increasingly onerous cost of owning a home has led to many in all age groups remaining in the renter cohort. While the overall U.S. homeownership rate is now near its long-term average, the rate amongst first-time buyers is still historically low.5 It is also well below the U.S. average in the Northeast and West regions, especially in the major markets where the cost of living is very high.
While more Millennials (~72 million) are buying homes, Gen Z (~70 million) has started to enter the workforce and will remain in the renter cohort for the next decade or so. Furthermore, more Gen X-ers and Baby Boomers (~133 million combined) are choosing to rent for lifestyle reasons.6
Additional key factors likely to sustain future rental housing fundamentals include strong ongoing job and wage growth, elevated construction and replacement costs, and tighter lending conditions for new construction, which will likely suppress future new supply.
FINANCIAL HEADWINDS: ACUTE FOR-SALE HOUSING AFFORDABILITY CHALLENGE PERSISTS
Cheaper to Rent than to Own in Most Metros. U.S. for-sale housing affordability is now at a record low (Figure 2). It is now cheaper to rent than to buy in most of the largest U.S. metros.7 Since Q4 2019, monthly rents have risen by 28%, while mortgage payments have climbed by 92%.8
FIGURE 2: U.S. FOR-SALE HOUSING AFFORDABILITY WORSENS
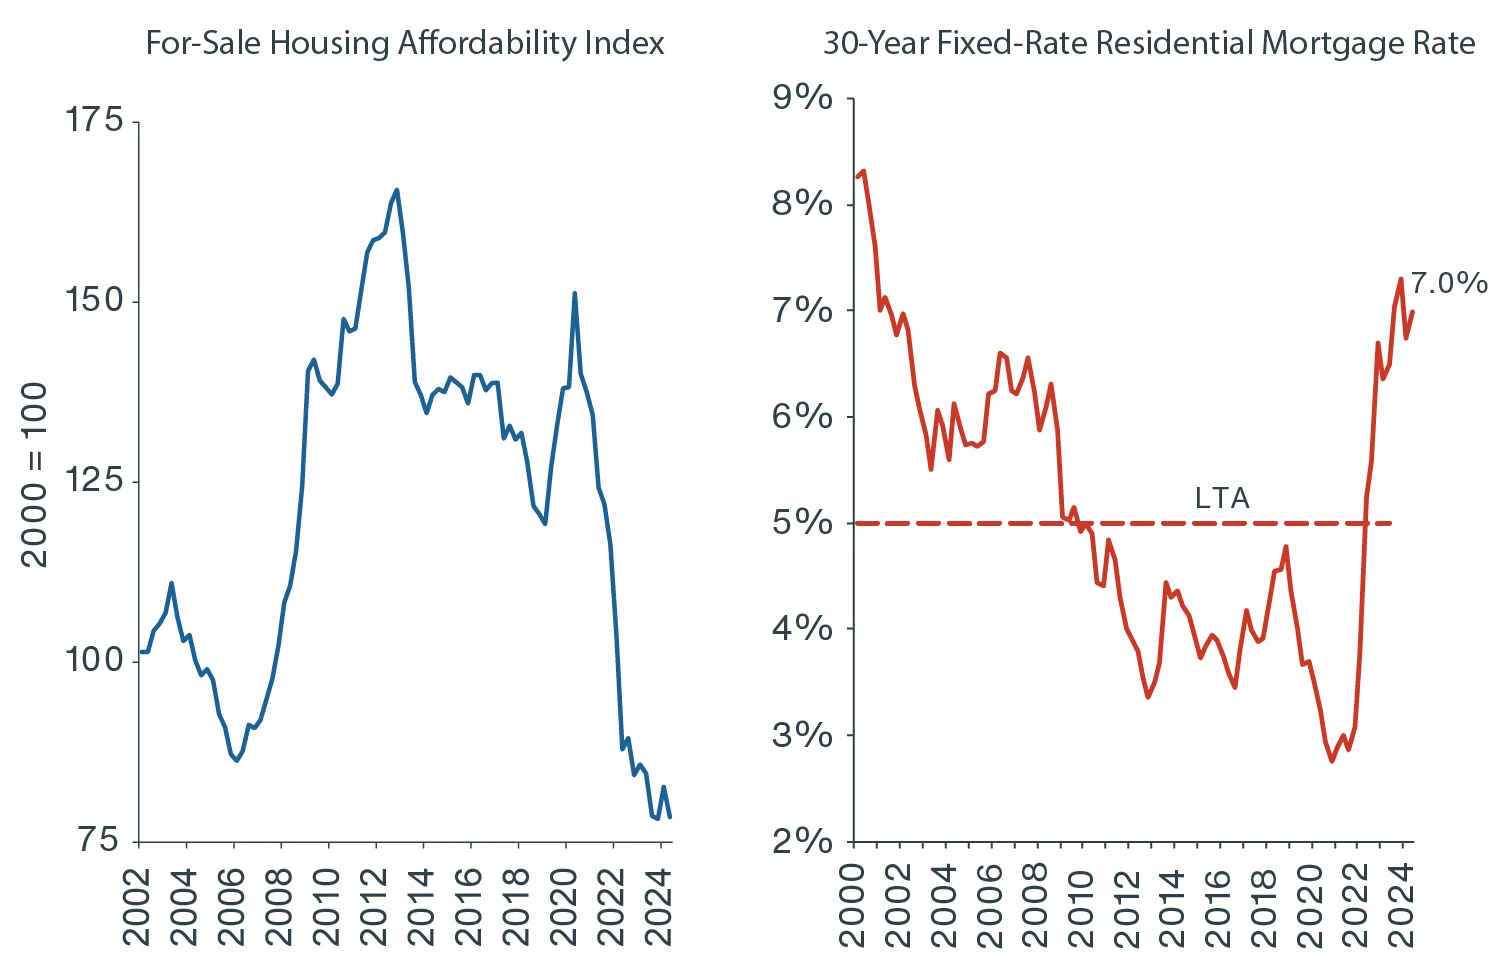
Source: Moody’s Analytics, Clarion Partners Investment Research, Q2 2024. Note: For-sale housing affordability index based on Moody’s Analytics model that factors in three variables: 30-Year Fixed Rate Mortgage Commitment Rate – National, FHFA Purchase-Only Home Price Index, and Median Household Income. LTA = long-term average.
U.S. For-Sale Housing Price Has Continued to Climb. Over the past decade, the U.S. median home price has risen swiftly, up by almost 100% from $207,000 to $403,730.9 During this time, the national average income grew by 42%.10 Housing prices in many secondary markets in the South and West regions approached new highs, with prices in a few rivaling the levels of some high-cost major markets. However, overall home prices are still significantly lower in much of the Sun Belt.
Many U.S. Counties Report a Home Price Above the National Median. Many of the most populous U.S. counties report home prices above the U.S. median level (Figure 3). Of the 50 largest metropolitan statistical areas, 32 now have median home prices above that of the nation, which has climbed from 24 in 2013.11 This has led to a greater demand for high-quality Class A and B rental housing in more metros.
FIGURE 3: 2024: MEDIAN HOME PRICE BY COUNTY (U.S. Median Home Price = $403,730)
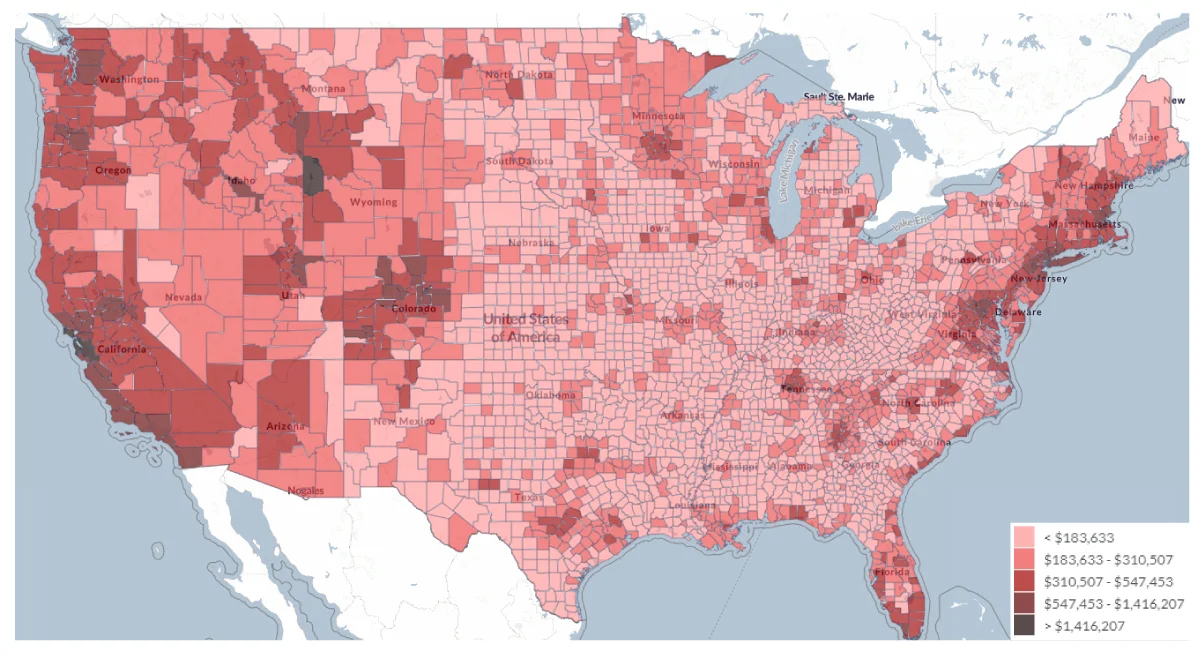
Source: StratoDem, Clarion Partners Investment Research, Q2 2024. Data as of Q2 2024.
Explosion in Renter Households. The widening gap between the cost to rent and own has led to a rapid rise in renter households. In Q2 2024, the number of renter households in the U.S. grew three times faster than the number of owner households.12
Rise in Cost-Burdened Households. Furthermore, over recent years, there has been a rise in total cost-burdened households, which pay more than 30% of their monthly income on housing costs. Of ~130 million U.S. households, over 30% are now cost-burdened, representing the highest rate on record.13 The share of severely cost-burdened households (those paying over 50% of monthly income on housing costs) is significant for both renter and owner households.14
ONGOING SHIFT: SUN BELT LURE & SUBURBAN BOOM
Higher for-sale housing costs have shifted residential mobility patterns and the geography of housing demand. Recent domestic migration and population growth trends have continued to heavily favor the Sun Belt and suburbs, which have had a significant impact on CRE demand overall in these areas.
- Sun Belt Lure
During the pandemic, Sun Belt markets saw a surge in in-migration, often at the expense of major markets. Looking ahead, Clarion Partners anticipates the Sun Belt boom will continue given the relative cost of living, quality of life, and job opportunities. Overall, the Sun Belt markets’ rental housing costs still offer a sizable discount relative to the six major markets at about 45% (Figure 4). Over the next five years, the top markets for population and employment growth are largely forecast to be in Texas, Florida, North Carolina, Nevada, Utah, Arizona, and Tennessee (Figure 5).
FIGURE 4: SUN BELT APARTMENT RENT DISCOUNT RELATIVE TO SIX MAJOR MARKETS
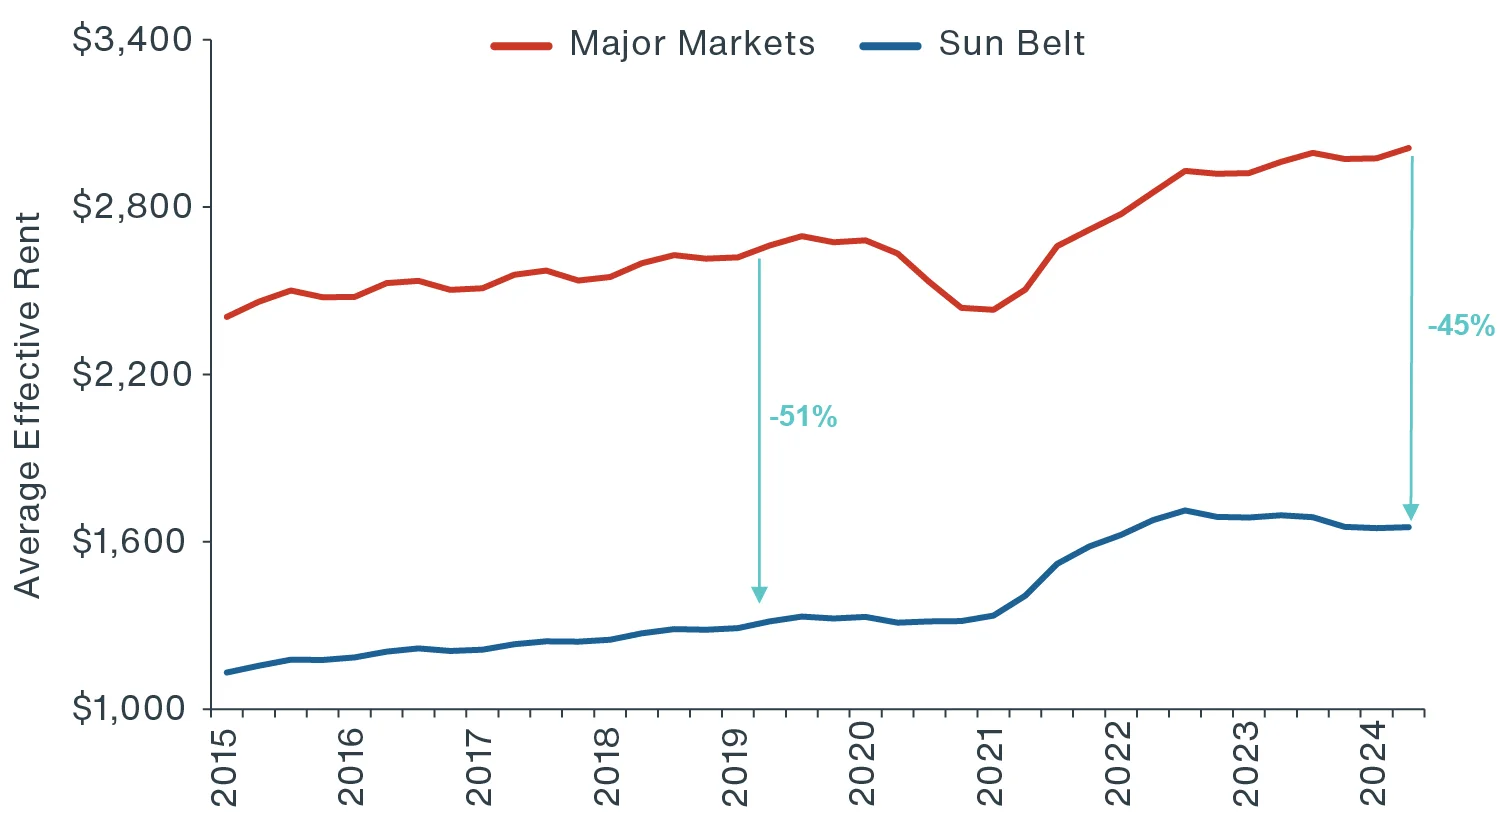
Source: CBRE-EA, Q2 2024. Note: Six major markets include New York, Boston, San Francisco, Los Angeles, Washington D.C., & Chicago. Sun Belt markets include Miami, West Palm Beach, Nashville, Dallas, Austin, Charlotte, Raleigh, Tampa, Jacksonville, Phoenix, Orlando, Fort Worth, Houston, Salt Lake City, & Las Vegas. Data labels as of Q2 2019 and Q2 2024.
FIGURE 5: SUN BELT MARKETS’ OUTLOOK STRONGEST: TOP 20 MARKETS FOR TOTAL POPULATION & JOB GROWTH (2024F-2028F)
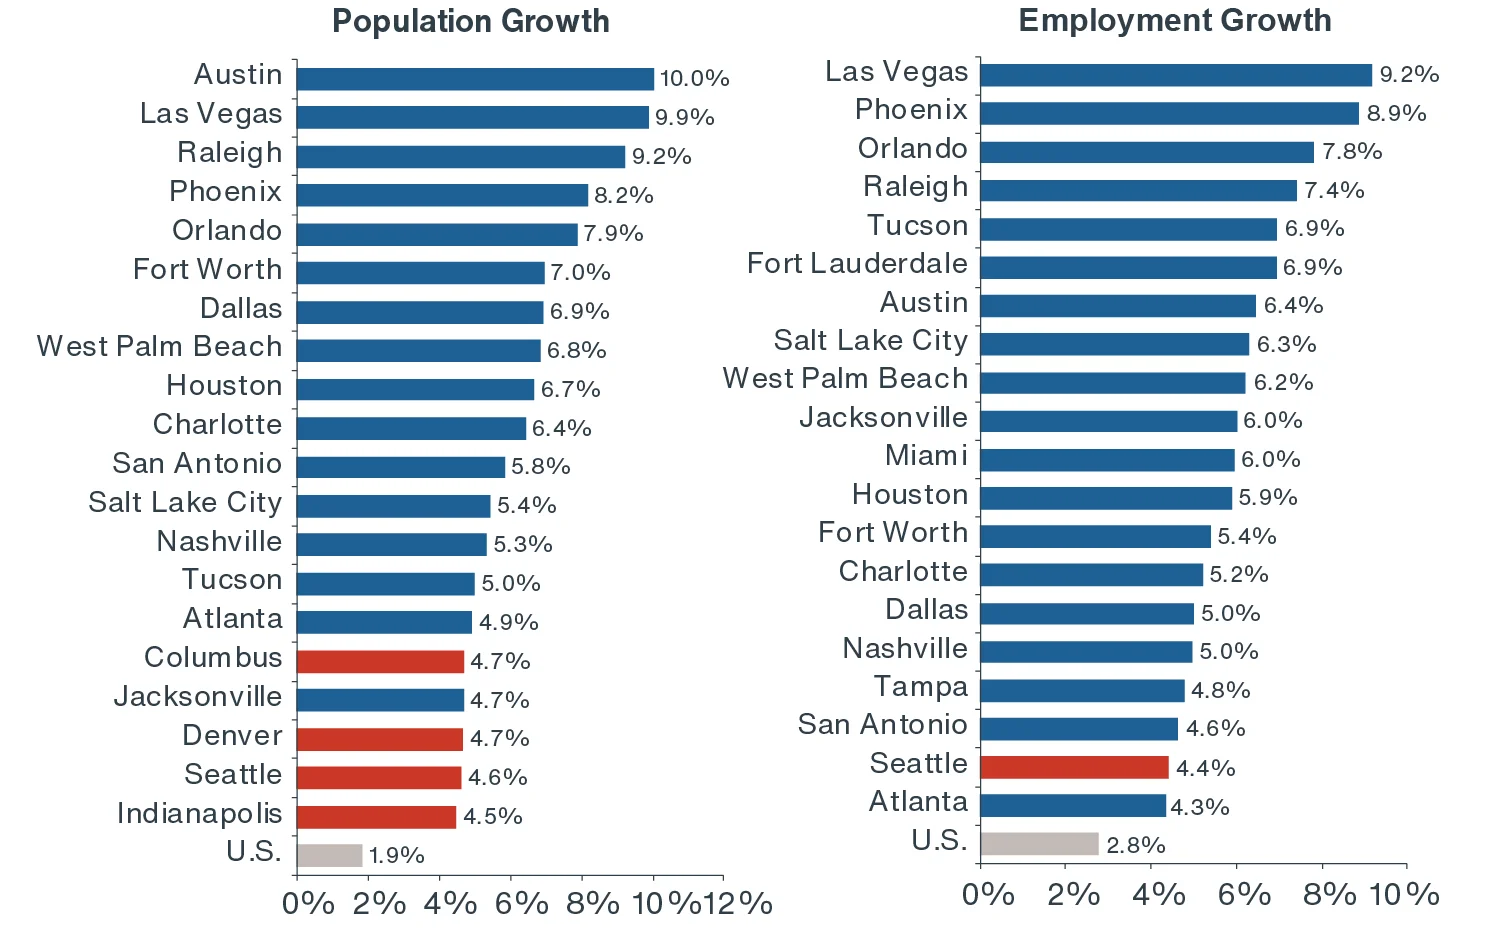
Source: Moody’s Analytics, Clarion Partners Investment Research, Q2 2024. Note: Blue bar = Sun Belt and red bar = non-Sun Belt. Calculation used forecast cumulative data from Q2 2022 to Q4 2027.
- Suburban Boom
At the same time, with a robust inflow of Gen Z and Millennials into the central business districts (CBDs) of major markets, we expect steady demand there as well in the years ahead. However, as Millennials reach middle age, cost pressures mount, and growth industries are more diversified by region, we expect strong rent growth performance in the urban fringe and suburbs to persist. More young adults are choosing to live in suburbs to have families, more living space, and access to better public schools.
MULTIFAMILY INVESTMENT PERFORMANCE STRONG, ESPECIALLY IN CERTAIN SEGMENTS
Over the past decade, the NCREIF Property Index multifamily subindex (stabilized and unlevered) has performed very well (Figure 6). The short- and long-term total returns have also indicated strong outperformance in the Mountain, Southeast, and Southwest regions, along with the two lower-density multifamily formats - garden-style and low-rise apartments. Given the recent population, migration, and job growth trends, Clarion Partners believes that CRE investors should align investment strategies accordingly in the future.
FIGURE 6: NCREIF MULTIFAMILY INVESTMENT PERFORMANCE: 10-YEAR TOTAL RETURNS BY SEGMENT
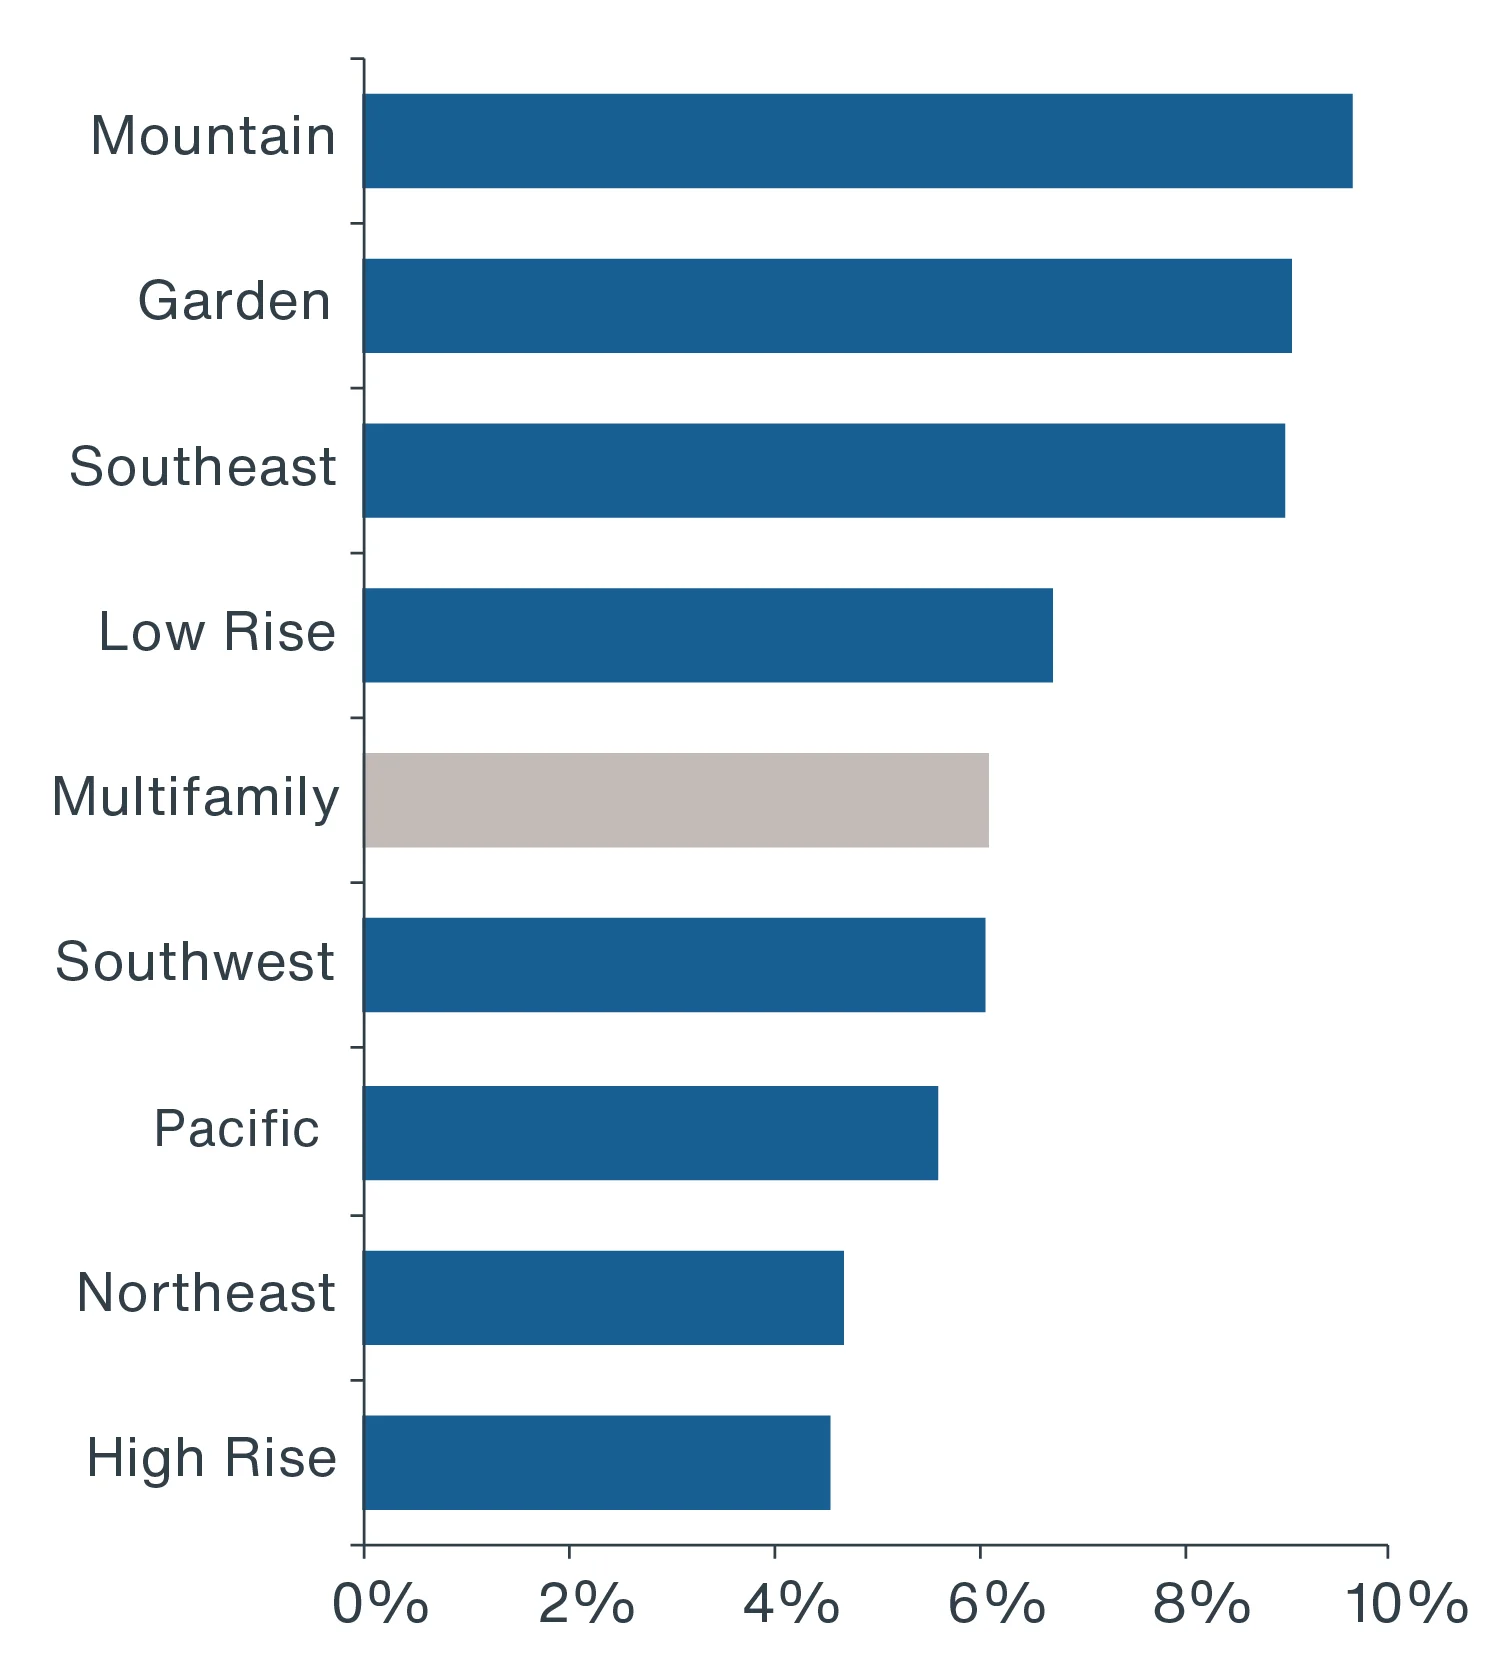
Source: NCREIF Property Index, Clarion Partners Investment Research, Q2 2024. Note: Past performance is not indicative of future results.
Going forward, we believe there are several other considerations to bear in mind as a multifamily investor:
- Political risks (i.e., rent control and environmental mandates/policies);
- High-growth industry clusters (i.e., tech, life sciences, & health care);
- Climate change risks;
- The high cost of living, including food, electricity, transportation, & caregiving; and
- The potential endurance of remote and hybrid work; physical office occupancy now averages about 50% of pre-COVID levels, which may influence future living arrangements.15
Elevated new supply levels from 2022 to 2024 have caused an uptick in the historically low rental housing vacancy rate; however, we expect rental demand to remain strong given the acute housing shortage theme.16
Last, but not least, multifamily housing landlords can adjust rent more quickly than in other sectors. Therefore, multifamily investments can potentially serve as a hedge against rising inflation, a desirable characteristic in today’s inflationary environment.
INVESTMENT FOCUS
Over the past decade, U.S. rental housing fundamentals have remained very healthy overall. U.S. multifamily rents are at all-time highs, and most top markets report vacancy rates under 5.5%.17 Furthermore, most major markets reported positive rent growth in 2023. Year-to-date in 2024, U.S. rent growth has also remained positive.18 Clarion Partners is focused on the following acquisition and development investment strategies:
- Sun Belt metros with a concentration of high-growth industries, strong population growth, and a low cost of living;
- High-quality Class A and B apartments in top suburban and urban fringe submarkets of major and secondary markets;
- Large employment hubs with a high share of renters by necessity; and
- Assets targeting renters by choice in top lifestyle markets/submarkets.
To learn more, click here to watch our Trends in U.S. Multifamily Real Estate video.