INTRODUCTION
The European sale-leaseback (“SLB”) market continues to benefit from multiple tailwinds. In our
recently published research1, we discussed these drivers and, more broadly, the appeal of SLB strategies in Europe at this point in the economic/property cycle.
Since then, we believe that the SLB opportunity in Europe has become even more compelling. In this piece, we discuss the reasons why, review the investment attributes of SLBs, and outline some of the “best practices” for risk mitigation in SLB underwriting.
WHERE WE LEFT OFF?
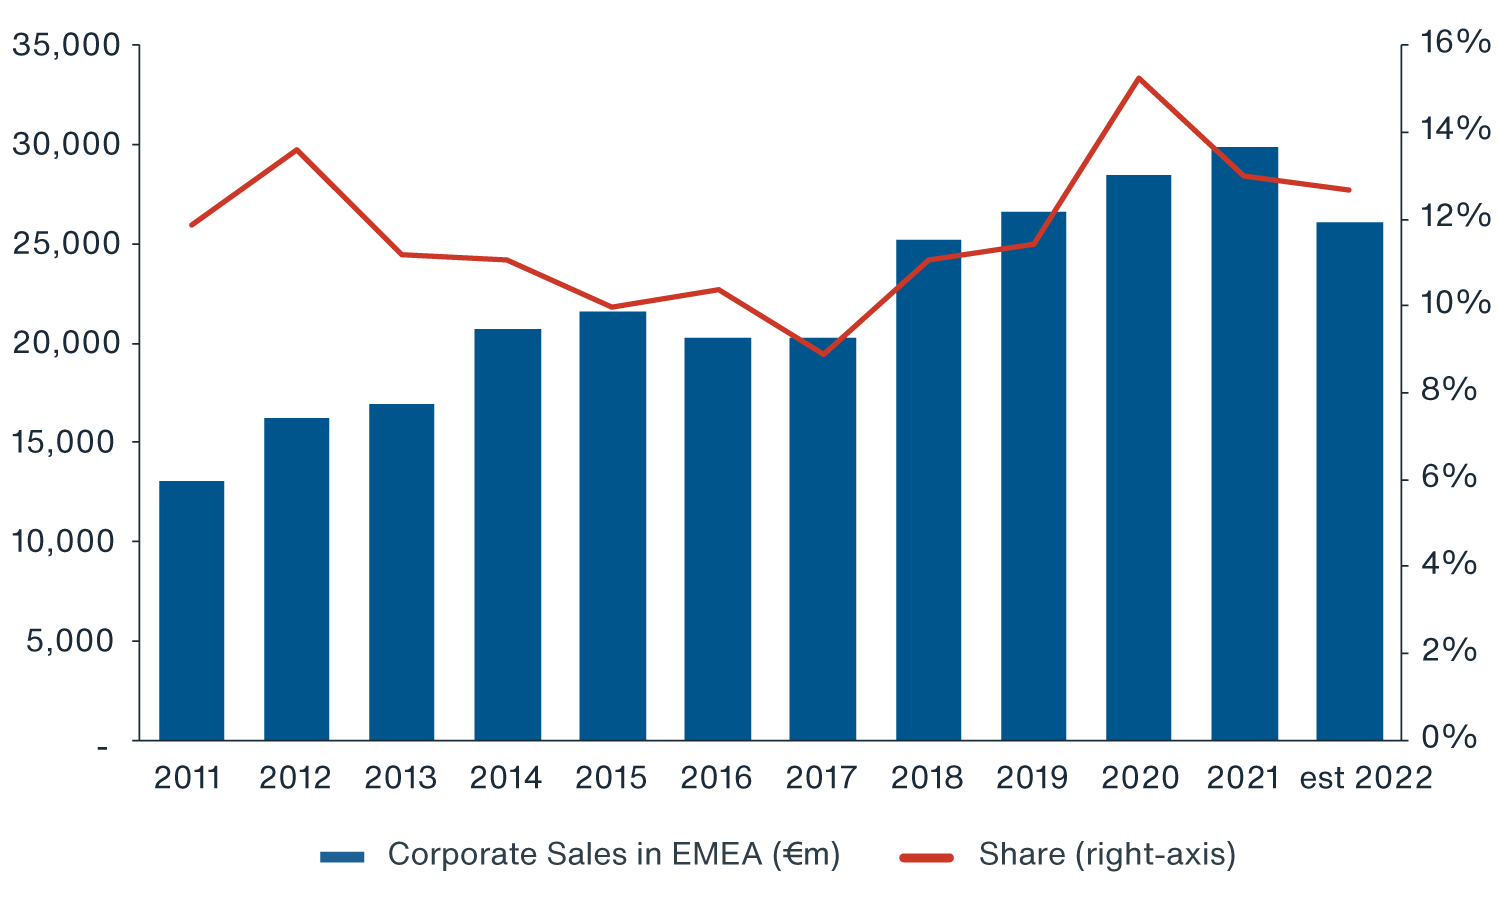
Corporate disposals (a proxy for SLBs) across EMEA have increased steadily over the last ten years, reaching a post-GFC high of ~€30bn in 2021. The generally favourable economic backdrop, robust M&A activity, and growing property valuations, enticing corporates to “cash in” on their real estate portfolios, are all believed to have contributed towards this growth. Corporate disposals slowed during 2022 amid rising interest rates and economic headwinds, but remained historically elevated with over €26bn transacted, equating to a market share of ~13% of all CRE volumes2 (Figure 1).
Data also indicates that at times of greater financial stress (e.g. at the peak of the Eurozone crisis in 2012, and more recently, during the Covid crisis in 2020) corporate disposals have accounted for a greater share of the private European commercial real estate (CRE) market. Given the delayed impact of monetary policy, there could potentially be more stress to come in Europe, especially in the corporate credit market. Clarion Partners believes that this challenging financial/economic environment is potentially conducive to SLB activity.
FIGURE 1: CORPORATE SALES IN EMEA HAVE MODERATED IN 2022
BUT REMAIN HISTORICALLY ELEVATED
Source: JLL, Clarion Partners Investment Research, August 2023.
EUROPE'S CREDIT CRUNCH COULD BE CATALYST FOR SLBS
The ongoing dislocation in the European corporate credit market is potentially the kind of once-in-a-cycle event that Clarion Partners believes is likely to drive increasing demand for SLBs as corporates seek to fill in the funding gap left by a retreating banking sector. There is a growing amount of evidence supporting this argument:
-
Borrowing cost at 15-year high: European corporates are grappling with the fastest hiking cycle in the ECB’s history. The Euro area deposit rate has increased by 450 bps to 4.0% since the ECB began hiking. Accordingly, the cost of borrowing for non-financial corporations in the Euro area has, as of July 2023, increased to a 15-year high (average of 4.9% from 1.8% in July 20223).
-
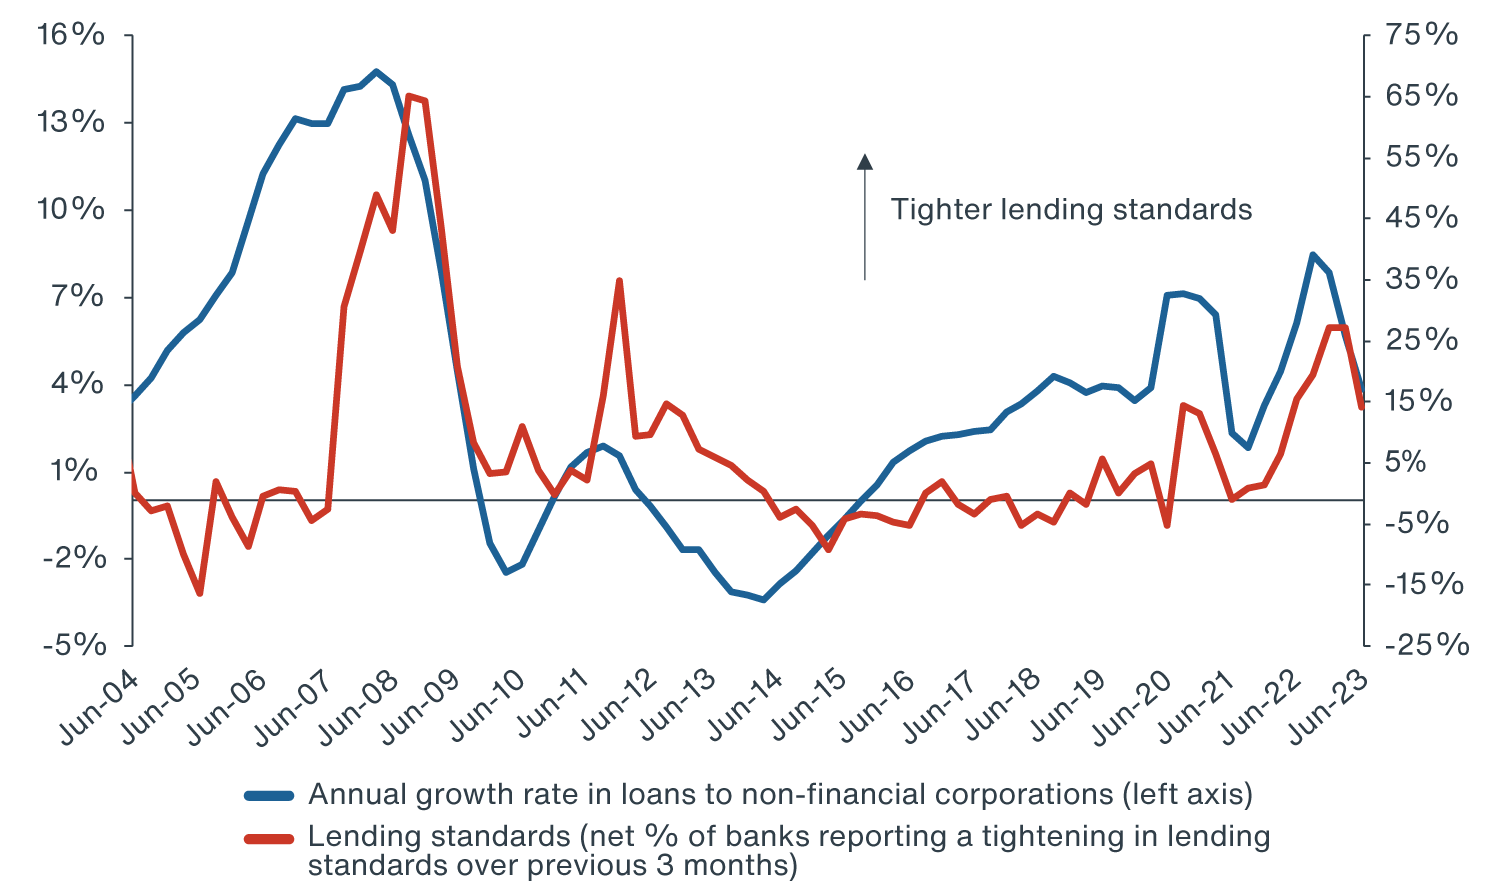
Historically tight lending standards: More importantly, increasingly
risk-averse European banks have considerably tightened their lending standards over the last 9-12 months4. (Figure 2) shows that lending standards (as measured by the ECB survey) tend to be a good leading indicator for the actual growth in corporate loans and can point to a further slowdown in the flow of credit to Euro-area firms going forward. This may incentivise corporates to explore other financing options such as SLBs.
FIGURE 2: LENDING TO EURO AREA CORPORATES HAS SLOWED
AS BANKS HAVE TIGHTENED CREDIT STANDARDS
Source: ECB, Moody's Analytics, Clarion Partners Investment Research, Q2 2023.
-
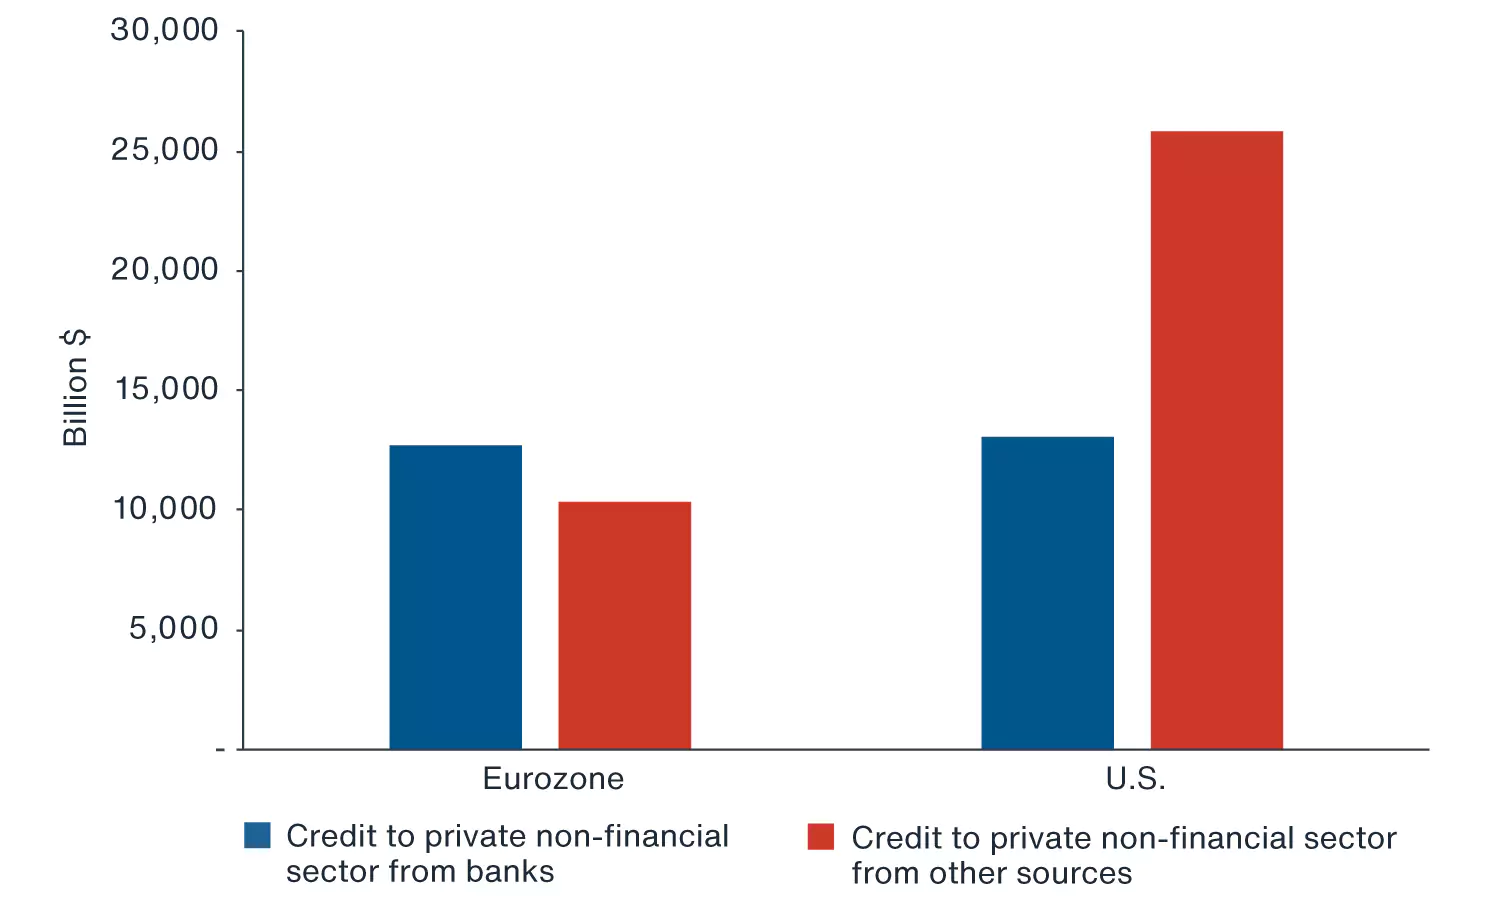
Traditionally, EU corporates are highly reliant on bank financing: This development is even more meaningful since European corporates are traditionally highly reliant on bank financing for their financing needs, more so, for example, than their United States counterparts that can tap into the deep and sophisticated U.S. capital markets to raise capital (Figure 3). As with bank financing, bond financing in Europe has also become more expensive, especially for sub-investment grade credit, deterring new issuance. The average yield-to-maturity for BB-rated credit was 7.25% in Q2 2023, compared to 5.69% in the same quarter last year and 2.95% in Q2 20215. With fewer traditional financing options available, EU corporates may be forced to consider alternative forms of financing such as SLBs.
FIGURE 3:
EUROPEAN CORPORATES ARE HIGHLY DEPENDENT
ON BANK CREDIT FOR THEIR FINANCING NEEDS
Source: Clarion Partners Investment Research's calculations based on data from Bank for International Settlements, Q4 2022.
-
Wall of maturing corporate bonds will need refinancing: The ultra-low interest rate environment preceding the current hiking cycle has allowed corporates to take out historically high volumes of relatively “cheap” debt. Some of this debt is coming to maturity and will need refinancing, highly likely at less attractive terms given the recent step-change in interest rates. This may encourage corporates to explore alternative financing methods such as SLBs. It is estimated that in Europe the share of sub-investment grade debt coming due within the next three years is at its highest since at least 20156. According to Deutsche Bank, there are some €23bn and €48bn of high-yield debt rated below BB maturing within the next 24 and 36 months, respectively.
- High owner-occupation rates in Europe: Besides these important cyclical factors, there are also “structural” factors likely to support the growth of the European SLB market in the longer term. Europe is characterised by high owner-occupation rates (estimated at 65%7), meaning that the addressable SLB market in Europe is arguably vast, compared, for example, to the U.S., where the corresponding figure is approximately 50%.
A STABLE, BOND-LIKE INVESTMENT WITH THE INFLATION-HEDGING CREDENTIALS OF REAL ESTATE
SLB investments can provide many of the benefits of both private CRE and fixed income. As with fixed-income, SLBs are typically characterised by more stable and predictable returns. We estimate that 70-90% of return in a typical SLB transaction comes from secure contractual income and contractual CPI increases. By extension, total returns are far less dependent on more volatile capital growth and the underlying uncertain market assumptions. Cashflow risks are mitigated through thorough tenant credit underwriting process and by investing in mission-critical properties, which increases chances of retaining the tenant on lease expiry. At the same time, SLBs offer many of the benefits of CRE investments:
-
Inflation indexation: SLB cashflows are typically linked to CPI, a major differentiator relative to other income-focussed alternatives such as corporate bonds, and a desirable characteristic in today’s inflationary environment. Inflation indexation also contributes to the appreciation of the underlying property in the longer term. In our previous research, we looked at “structural” factors that may contribute to above average inflation levels going forward, increasing the appeal of long inflation-linked cashflows accessible through SLB strategies.
-
Asset-backed investment: Owning the underlying real estate has the potential to allow investors to capture market upside while offering some downside protection in the event of tenant default. In contrast, holders of unsecured bonds run the risk of losing their coupon payments and principal altogether if the issuer defaults. It is estimated that between 1987 to 2020, the historical recovery rate for senior unsecured bonds was 47%8. Though not an exact stand-in, the chances of re-letting a property, if a tenant defaults on the lease, are arguably higher and proportional to the quality, location, and flexibility of the premises, among other things. Investing in high-quality, generic real estate that can be easily re-let is a key risk mitigation strategy in SLB transactions. Underwriting property types backed by long-term drivers also limits downside risks.
Triple net leases: SLB leases are typically triple net, whereby the tenant is contractually obligated to pay for most or all of property related expenses, insulating income from unforeseen increases in these costs. With ESG regulation expected to become increasingly stringent and potentially onerous for CRE owners, having “net” leases in place allows landlords (subject to negotiation) to pass all or part of the cost of ESG upgrades to tenants, protecting NOI.
AN ATTRACTIVE RISK-ADJUSTED INVESTMENT OPPORTUNITY
The “hybrid” nature of SLB investments, particularly the stability of cashflows, contributes to the attractive risk-adjusted returns of this type of investment (UK data is quoted here because the UK tends to have more granular data than other European countries):
-
Pre-pandemic, between 2005 and 2019, UK fund level returns for long lease portfolio (a proxy for SLB deals) averaged 7.2% compared to 6.9% for the wider UK Quarterly Index compiled by MSCI. What is more, the standard deviation of long lease assets was roughly two thirds of the volatility of the average assets in the quarterly index9.
According to Green Street, the UK Net Lease sector (which partly originates in SLBs) screens attractively relative to other property types, thanks to a high in-going cap rate and relatively low structural capex10. The UK average Net Lease cap rate, at 5.9%, was highest of all UK sectors in August 202311.
While income is the key driver of returns in a typical SLB deal, often overlooked is the ability to create value at deal origination and during the hold period. SLBs in Europe are often not widely marketed and the market is far less institutionalised than in the U.S. where 18 specialist net lease/SLB REITs exist in the public markets alone12, compared to only a handful in Europe13. SLB transactions may command a yield premium as a result. Moreover, SLBs allow investors to “tailor” lease terms to the transaction/tenant, ultimately to create value. Finally, SLBs assets tend to be asset management-light, with generally few landlord obligations.
CONCLUSION
Clarion Partners believes that the ongoing dislocation in European corporate credit markets potentially represents a once-in-a-cycle event that could accelerate the pace of CRE disposals from corporates unable or unwilling to finance themselves through the traditional channels, particularly banks. Bank lending standards, as measured by the ECB Euro Area Bank Lending Survey, are tighter than at all but three other periods since the beginning of the survey (in 2003, during the GFC and during the Eurozone crisis; in essence, current levels of tightening occur on average every five years).
A European SLB strategy can capitalise on this potentially growing pipeline, especially at a time when investors, unless motivated/in distress, may not necessarily be in a hurry to sell amid ongoing price discovery. In our view, SLBs’ stable, inflation-linked cash flows and historically attractive risk-adjusted returns could cater to investors looking for defensive, inflation-hedging, real estate allocations. Overall, Clarion Partners remains optimistic about the potential growth of the SLB market in Europe, particularly considering the strong growth of the same sector in the U.S.