INTRODUCTION
In March 2024, a large container ship struck the 47-year-old Francis Scott Key Bridge, causing a collapse. The cleanup and rebuilding of the bridge is estimated to cost at least $2 billion and is expected to take 18 months to several years to complete. While some level of cargo flow is expected to resume, physical constraints remain.
The Port of Baltimore is a key driver of Maryland’s economy, generating $5.3 billion in personal income, $3.9 billion in business income, and $647 million in taxes, in addition to supporting more than 20,000 direct jobs and 222,000 jobs connected to port work.1 The port also currently ranks as the 9th largest U.S. port for international cargo-and the largest U.S. port for the import/export of automobiles. The port has a much smaller presence in the movement of containers, which generally drive warehouse demand, handling 793,000 total loaded twenty-foot equivalent units (TEU's) in 2023, compared to over 5 million total TEUs processed at the Port of NY/NJ.2
PORT OPERATIONS
The impact will be heavily dependent on how long traffic is disrupted during the full repair of the bridge and channel. Temporary channels are being created, and officials expect the full shipping channel to be operational by late May 2024. Thousands of tons of collapsed bridge and road materials need to be cleared in order for large ships to be able to reach parts of the port further upstream in the Patapsco River. However, it is expected that cargo and cars will be redirected to other East Coast ports in the meantime. Data from the International Monetary Fund (IMF) shows that 43% of ships that stop at the Port of Baltimore also stop at the Port of Norfolk, 38% stop at the Port of NY/NJ, 11% stop at Charleston, and 7% stop at Savannah. It is expected that these ports will absorb much of the cargo originally destined for Baltimore without much disruption.
FIGURE 1: PORTS VISITED IMMEDIATELY BEFORE OR AFTER BALTIMORE
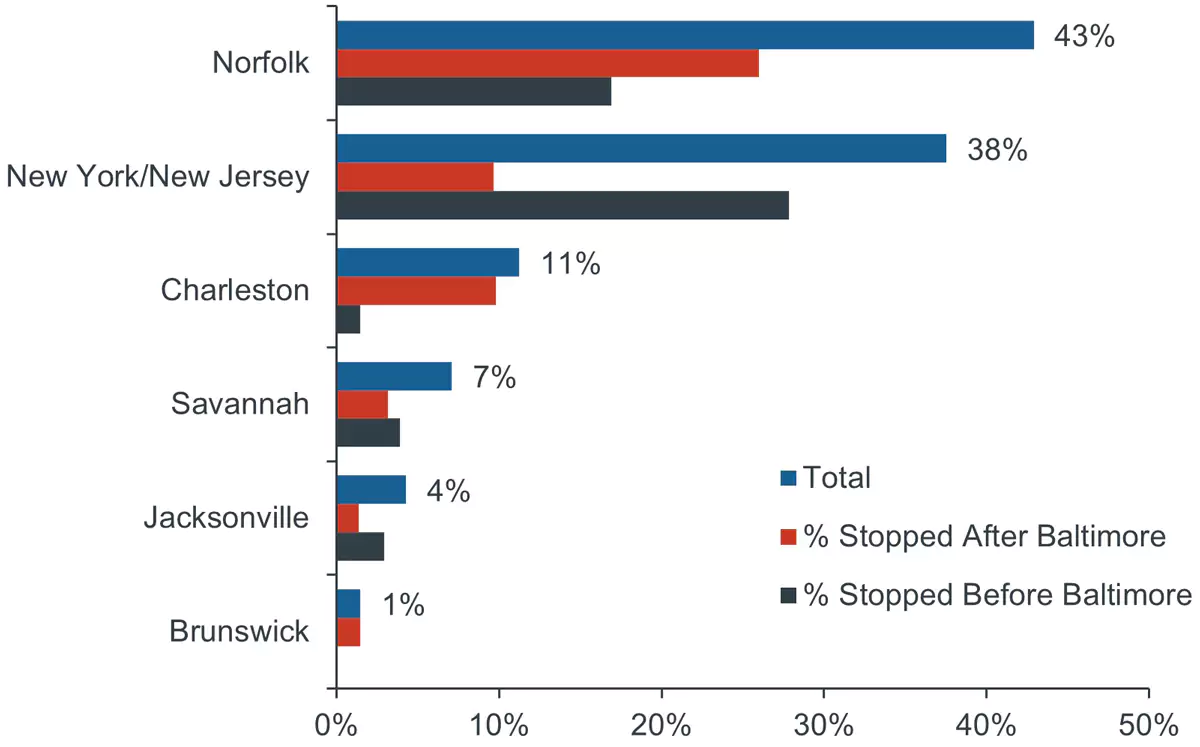
Source: IMF PortWatch, Clarion Partners Investment Research.
Total TEUs processed at the Port of Baltimore in 2023 would only account for 15% of total TEUs at the port of NY/NJ and 34% of total TEUs at the Port of Norfolk. The Port of NY/NJ saw volumes fall 17.7% in 2023, while volumes at Norfolk fell 11%, implying that there is excess capacity at these ports to absorb cargo originally destined for Baltimore. Additionally, CSX has started to offer a rail service designed to move diverted Baltimore freight from New York (Figure 1).
The Port of Baltimore is the busiest port in the U.S. for automobiles handling nearly 400,000 auto units in 2023, the most of any U.S. port for the 13th straight year. The port’s major role in automobiles creates the potential for disruption to shipping in that industry. However, one berth before the bridge remains open at Baltimore, and nearby ports should be able to handle the extra capacity.
The Port of Brunswick in Georgia is the second busiest port for the import/export of autos and has announced significant investments to expand capacity in recent years. The nearby port of Charleston also has a large automobile terminal.
BRIDGE IMPACT
The Francis Scott Key Bridge handles significantly lower amounts of overall vehicle traffic compared to other major transportation arteries in the metro. Traffic that would have used I-695 will likely be rerouted to I-95, the main distribution route for the Mid-Atlantic, potentially increasing congestion along the highway. However, given the significantly lower traffic count on the bridge, the impact of the additional traffic on I-95 is expected to be minimal. Additionally, according to the Maryland Department of Transportation, only 12% of traffic on the bridge is truck traffic (Figure 2).
FIGURE 2: AVERAGE DAILY TRAFFIC COUNT
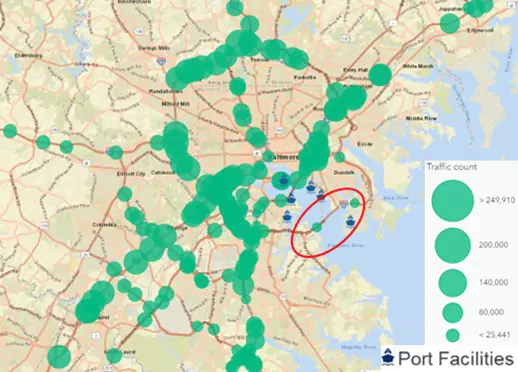
Source: ESRI, Clarion Partners Investment Research.
POSSIBLE LONG-TERM EFFECTS
Over the long-term, the Port of Baltimore is at risk to lose some business as other East Coast ports compete to capture this business during this downtime and rebuild. We do not expect the permanent loss of business to be substantial, however, given the port’s proximity and importance to regional and global businesses. Baltimore's port is located 150 miles further inland than any other Mid-Atlantic port which means shorter distances between the manufacturer, port, and market, thereby expediting exports a day sooner. Most of these businesses also have contracts to support those shipping activities that they cannot simply terminate, such as 3PLs, warehouse space, and labor. Costs for the auto industry could see upward pressure given added shipping expenses and time. This industry tends to run lean (costs are estimated at $1.3 million per hour) and is highly sensitive to downtime. However, 400,000 vehicles is a fraction of the 15 million units sold just in the U.S. annually, and this development comes at a time when car prices are beginning to show downward pressure. The net impact on consumer prices should be minimal. The Baltimore metro area could also benefit from updated – and likely expanded – infrastructure once the bridge rebuild is complete.
SUMMARY
Overall, the impact of the collapse of the Francis Scott Key Bridge is still unknown until a timeline for full reopening is announced. However, given the extra capacity available at other nearby East Coast ports, in which many ships are already stopping, there should not be major disruptions to the container trade. The automobile sector is most likely to face potential bottlenecks, though investment at other East Coast ports should limit the impact. From a traffic perspective, the bridge collapse will result in redirected traffic toward I-95 and I-895 potentially increasing congestion on those highways. The impact of this will likely be limited, however, since the bridge has a significantly lower traffic count than other major arteries.