In the past decade, eastern U.S. industrial markets have gained considerable market share of the collective national trade volume. U.S. West Coast (USWC) port dominance has been gradually eroding as U.S. East Coast (USEC) ports capture more and more eastbound transpacific container trade (Figure 1). A number of structural factors have contributed to this ongoing shift, mainly:
- A significantly larger population in the Eastern U.S.;
- Increasing demand from last-mile supply chains, and;
- Shifting trade dynamics – most notably, U.S.-China trade policy and the opening of the Neopanamax Canal.
Recent demand indicators and investment performance have been strong at many high-growth eastern U.S. industrial hubs, many of which now report vacancy levels below 4.0%. Clarion Partners estimates that at least another 1 billion SF of new warehouse and distribution space will be delivered through 2025 to accommodate changing consumer behavior and demographic patterns, of which 71% will be in the Eastern U.S.
FIGURE 1: EAST, WEST, & GULF COAST SHARE OF TEU VOLUME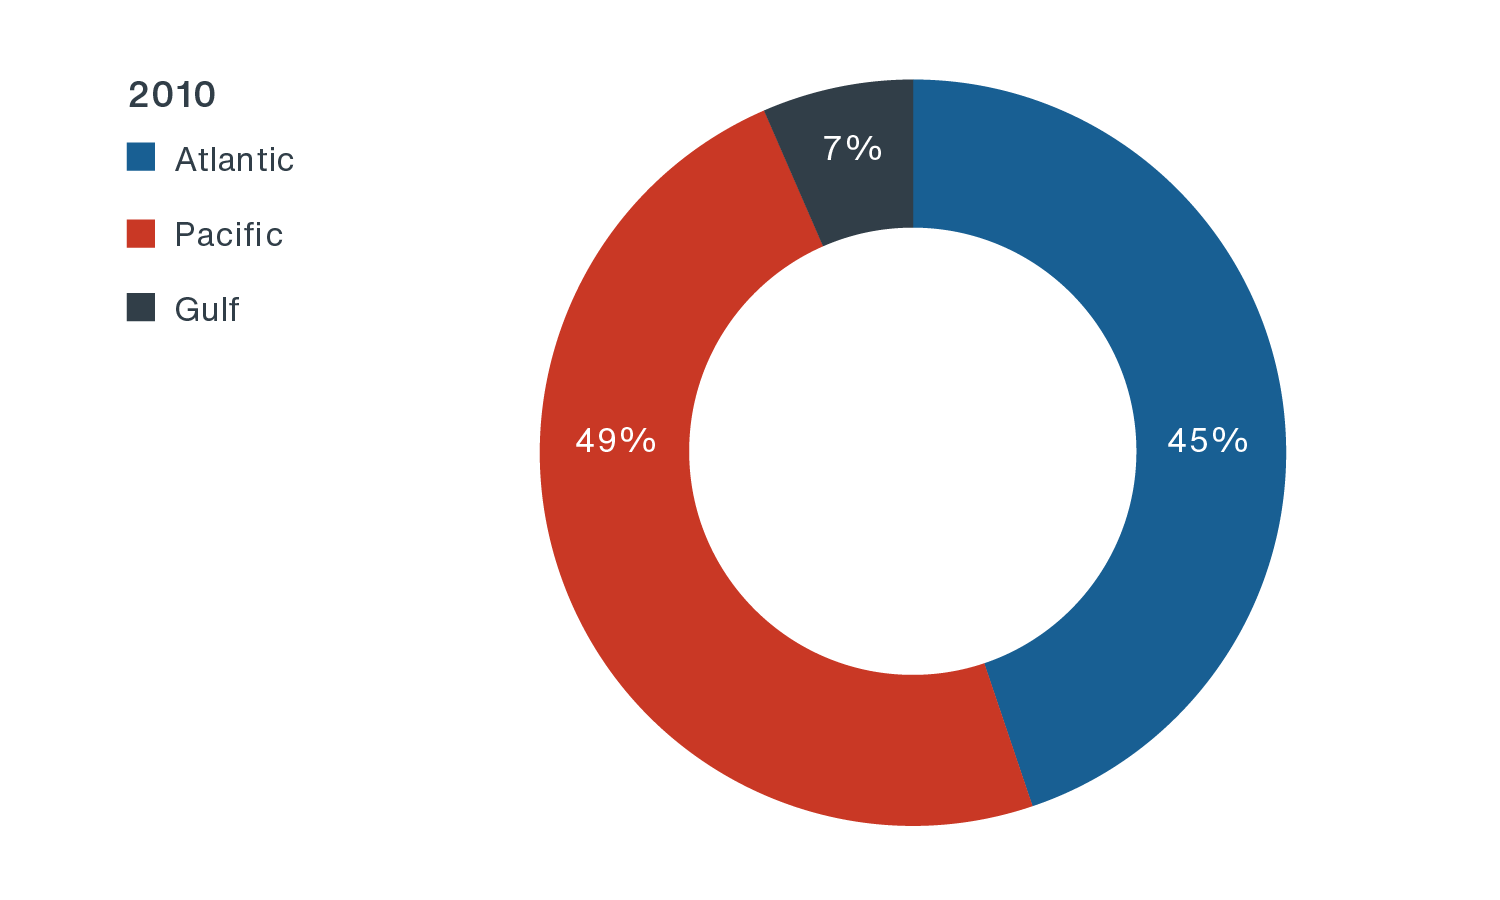
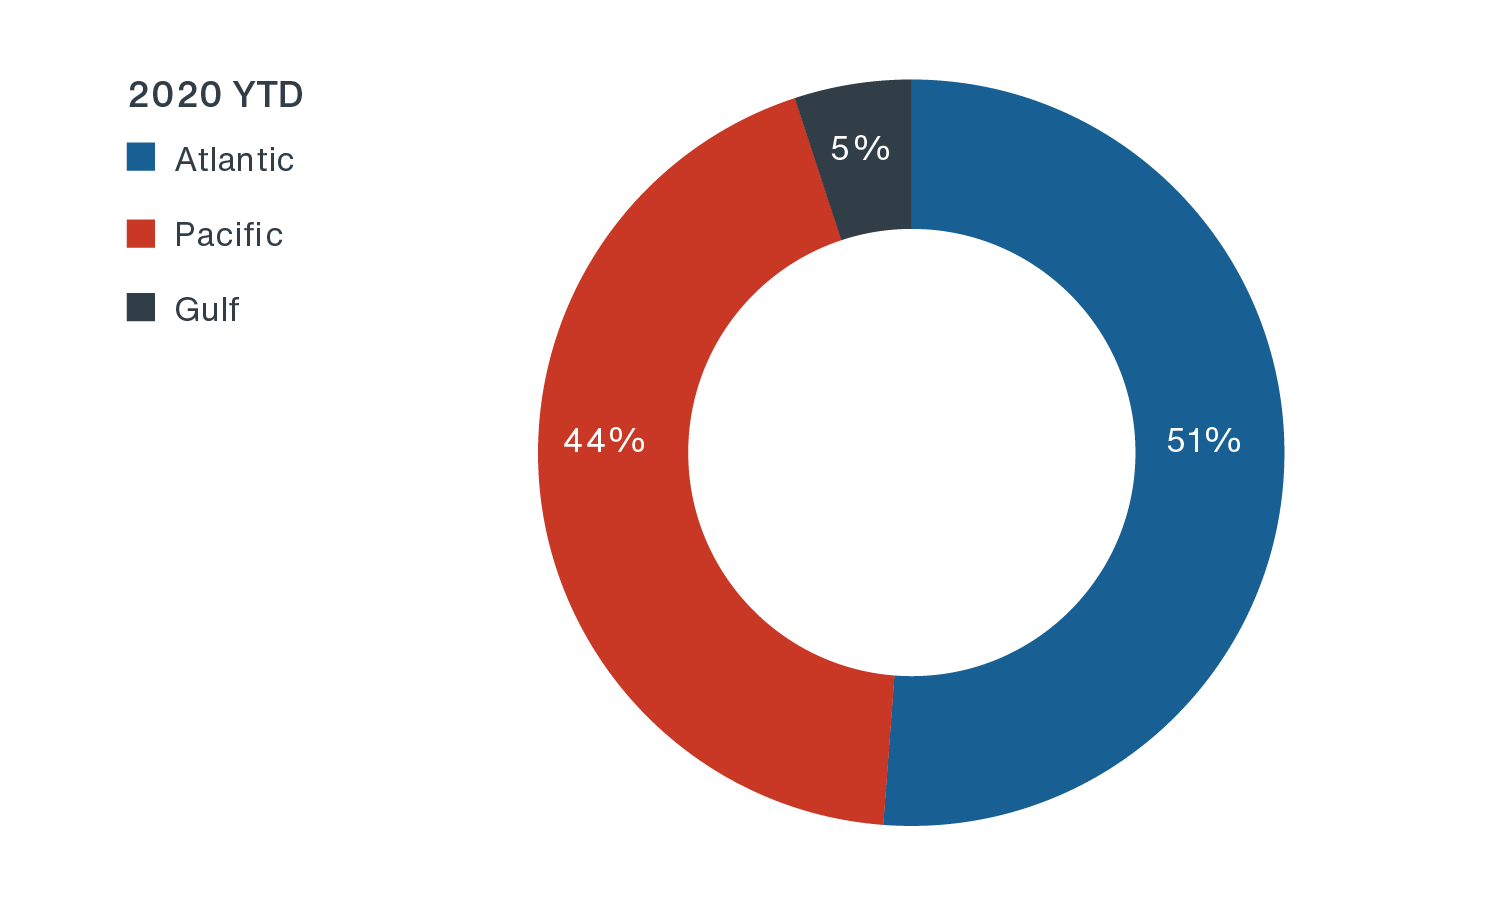
Source: U.S. Department of Transportation, Pacific Merchant Shipping Association (PMSA), March 2020. Note: 1) TEU volumes include imports and exports of loaded containers only. 2) Coastal groupings are based on PMSA groupings, which represent 90% of total U.S. TEU volume. 3) TEU = twenty-foot equivalent unit.1
PRIMARY CAUSES FOR SHIFTING COASTAL VOLUMES
U.S. Population Divide
Currently, about 65% of Americans reside in the Eastern U.S (Figure 2).2 Of the 64 U.S. cities with a population over 1 million, the vast majority (44) are in the Eastern U.S., while there are only fourteen and six in the West and Central U.S., respectively. Already-robust warehouse and distribution demand is now intensifying around the largest U.S. population clusters, as post-COVID 19 non-store shopping preferences are accelerating the pace of online sales growth.
FIGURE 2: 2019 STATE POPULATIONS: ABOUT 65% OF NATION RESIDES IN EASTERN U.S.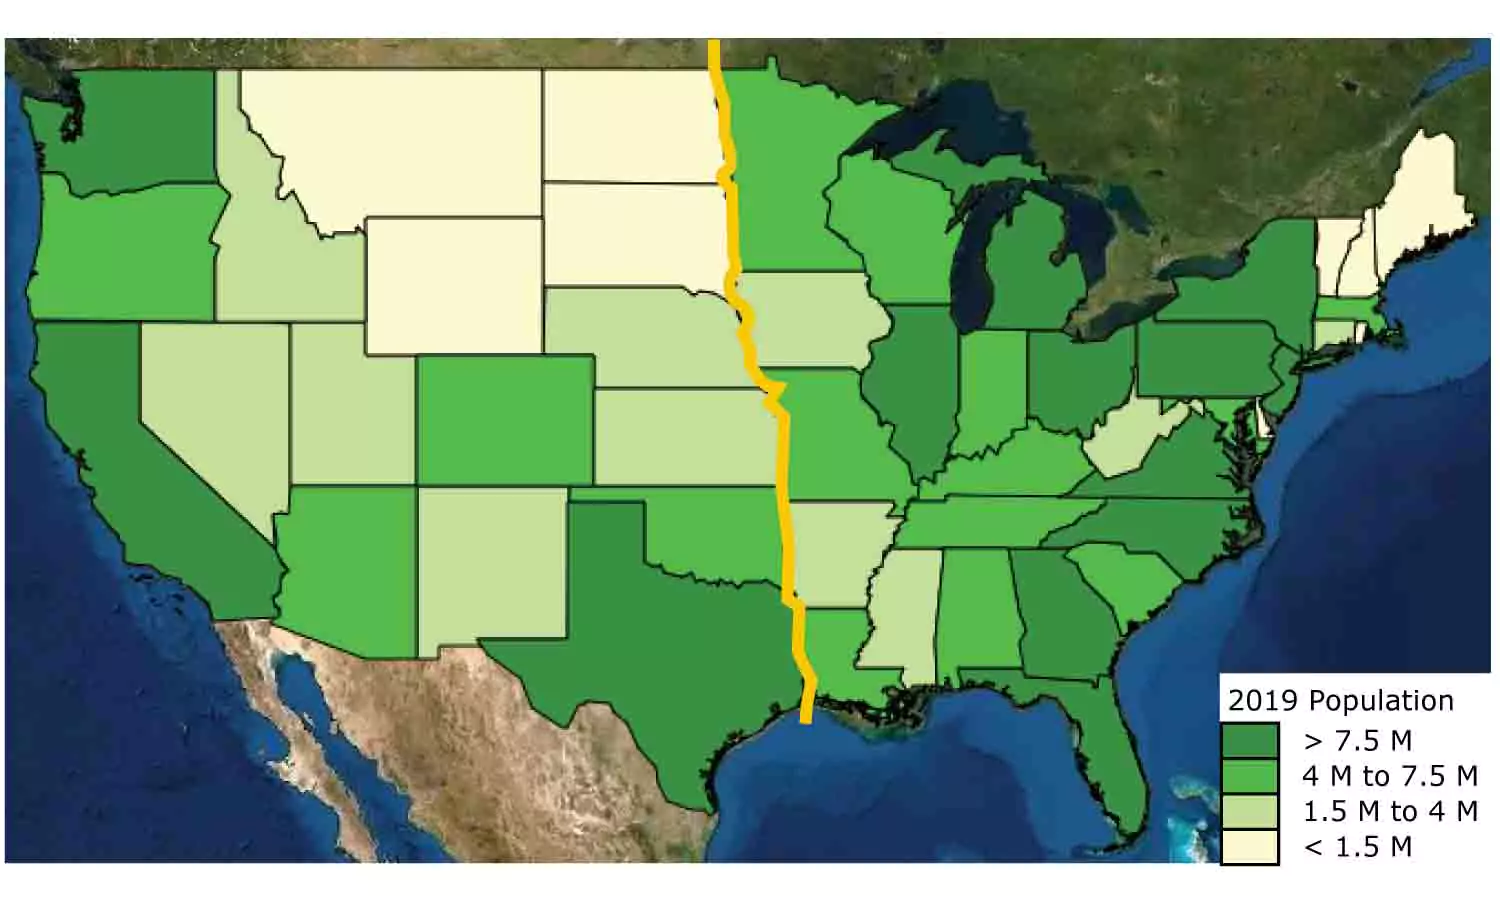
Source: ESRI, Clarion Partners Investment Research, Q1 2020. Note: Eastern U.S. includes 32 states.
Last-Mile Supply Chain
Clarion Partners believes that expansion of Amazon is the most vivid illustration of the explosive dominance of e-commerce. The company now represents about 50% of all U.S. online sales, which grew at an annual pace of approximately 25% from 2015 to 2019.3 The most recent wave of U.S. e-commerce sales growth following the onset of COVID-19 has been more broad-based by retailer. In Q1 2020, annual online sales growth figures for Amazon, Walmart, Lowe’s, Target, and Best Buy were 26%, 74%, 80%, 141%, and 155%, respectively.4 These growth metrics (excluding Amazon’s) were the highest on record in 20 years. The top 100 largest retailers also reported e-commerce sales growth year-over-year of over 70% in May and June.
The U.S. Census Bureau indicates that e-commerce sales still represent a mere 15% of total core U.S. retail sales. Using this calculation, we believe we are about halfway through the build-out of the required e-commerce infrastructure if that share were to rise to 30% by 2030. This is a positive for new and existing warehouse demand serving last-mile industrial markets in large urban areas.
Shifting Trade Dynamics
U.S. state and metro-level growth trends are impacting global trade routes as well. Since the most recent economic expansion began in 2010, the gains made by the USEC and U.S. Gulf Coast (USGC) ports have accelerated; however, this shift has been two decades in the making. Recent TEU volume growth by region illustrates the long- and short-term shifts underway:
- During the 2000-2017 period, the total number of loaded containers moving through all USWC ports rose by only 64.4%, whereas USEC ports collectively reported a 126.9% jump. Even steeper was the 157.4% surge at USGC ports.5
- In 2019, inbound loaded TEU volume increased by over 350,000 at the nine East Coast ports and by over 80,000 in the Gulf Coast, where as it fell by over 660,000 at the five largest West Coast Ports.6
The eastward shift has occurred for a variety of reasons:
-
West Coast Ports Are Restricted in Terms of Physical Growth, Higher Costs, & Labor Disputes. At the primary USWC ports (Los Angeles/Long Beach, Seattle/Tacoma, and Oakland), available land is scarce and expensive. These ports have also lagged USEC counterparts in updating port infrastructure. At the same time, the high cost of doing business in California, which has strict environmental policies in place, has contributed to higher operating costs in much of the West. Furthermore, there have been periodic labor management issues. The longshore labor dispute, which began in 2012, substantially slowed container traffic through USWC ports.7
- 2016 Opening of Widened Panama Canal. An increasingly large number of containers bound from East Asia to U.S. markets have been arriving at East and Gulf Coast ports. For many years, USWC ports dominated trade with the fast-growing economies of East Asia. By contrast, USEC ports primarily served trade with the more advanced and slower-growth economies of Europe.8 Following the Panama Canal expansion and re-opening in late 2016, the diversion of imports from East Asia to non-USWC North American ports accelerated. From 2016 to 2018, Panama Canal cargo tonnage grew by 25%.9 Nonetheless, since the onset of the U.S. China trade war, traffic flows through the canal have moderated.
However, going forward, the Panama Canal is likely to be a key channel through which ship traffic arrives on the East Coast. In 2019, 66% of all cargo moving through the Panama Canal was either coming from, or going to, the East or Gulf Coasts of the U.S, while the Americas accounted for less than 10% of Suez Canal cargo traffic.10
-
Large Investments in East Coast Port Infrastructure. By 2019, most USEC ports had invested heavily in the physical infrastructure needed to support more international trade and larger ships. This has also contributed to the loss in USWC ports’ market shares in containerized import tonnage to those of East and Gulf Coast ports. According to the Pacific Merchant Shipping Association(PMSA), the transatlantic trade flows from the Europe, Middle East, and Asia (EMEA) region have remained relatively constant; however, more transpacific cargo has been re-routed to bypass USWC ports and go directly to the Eastern shoreline.
From 2010 to 2019, growth in containerized import cargo tonnage from East Asia by port and region has varied greatly, and the West Coast has fallen behind.
- USWC: Los Angeles and Long Beach = +12.5%, Oakland = +16.6%, and Northwest Seaport Alliance (NWSA) = 22.9%
- USEC: New York/New Jersey = + 37.9%, Savannah = +93.0%, and Charleston = +124.5%
- USGC: Houston = + 200.2%
At the same time, industrial markets’ operating costs in the Southeast are still substantially lower than in the Northeast. In 2019, high-growth USEC ports by TEU volume included Miami, Savannah, Jacksonville (Jaxport), and South Carolina/Charleston (Figure 3).
FIGURE 3: 2019 ANNUAL GROWTH IN INDIVIDUAL PORT TEU VOLUME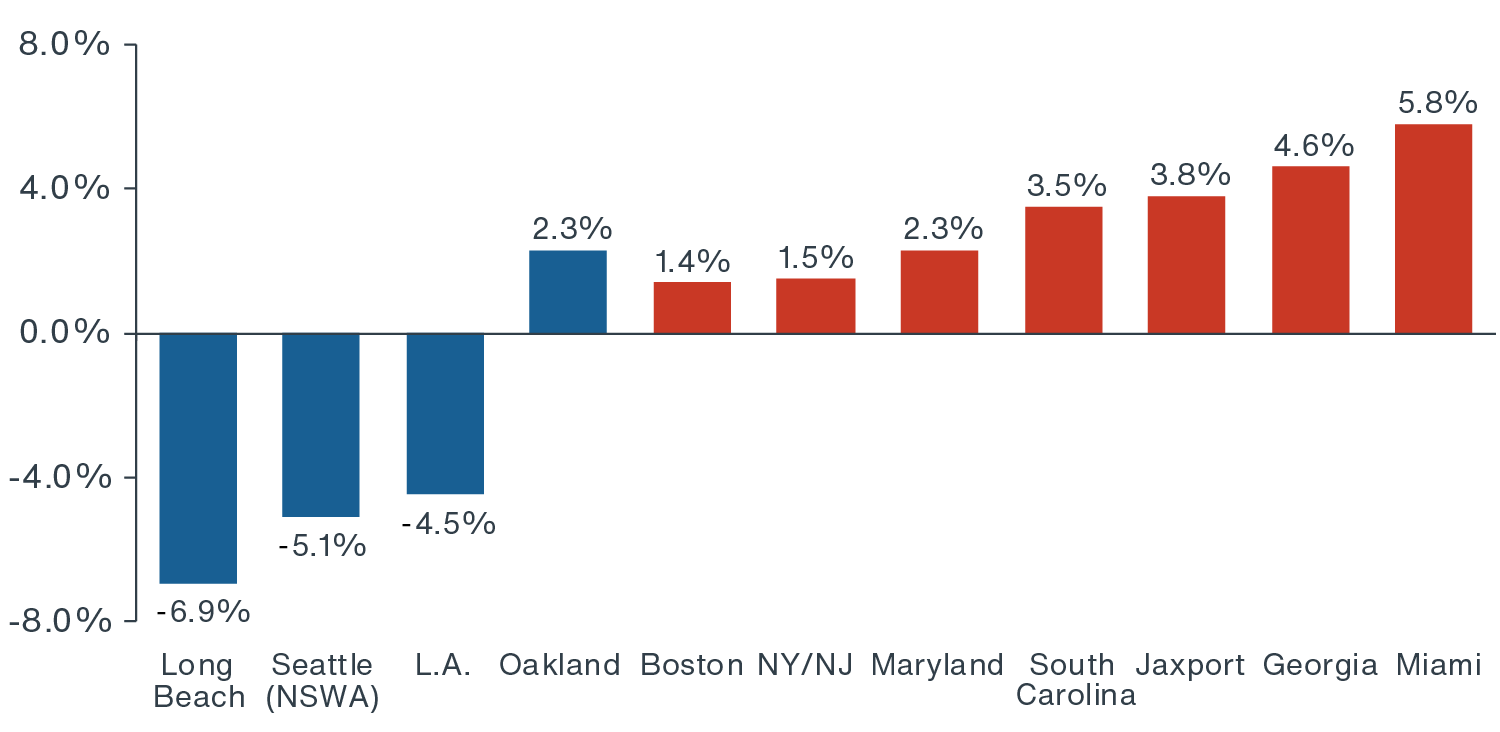
Source: Individual Ports’ websites, Clarion Partners Investment Research, Q1 2020. Note: The Northwest Seaport Alliance (NWSA) includes the Port of Seattle and Port of Tacoma. It is the fourth-largest container gateway in North America.
China trade war has somewhat distorted established trade patterns and alliances. Volumes of containerized trade through USWC ports from Asia have also been greatly reduced by rounds of new U.S. and retaliatory tariffs that were first imposed in 2018. Trade levels and partnerships throughout Asia have also begun to shift. According to AT Kearney, the conflict has spurred a sharp reversal in the reshoring index and supply chains as, specifically, imports from Mexico are growing and new lower cost trade partners in Southeast Asia are becoming more active.11
The fall-off in the USWC share of U.S. containerized import tonnage from East Asia has been significant. In 2004, the USWC share was 75.1%; by the end of 2019, it had plunged to 57.0%. Meanwhile, the USEC ports grew their share from 23.6% to 36.1%. USGC ports saw their share soar from 1.6% in 2003 to 7.0% last year.12 The drop in containerized import tonnage from East Asia has been most precipitous at the Ports of Los Angeles and Long Beach in recent years.
-
Post COVID-19 International Trade Policy Controls. Going forward, both ongoing trade tensions and COVID-19 are likely to lead to more near-shoring and on-shoring of consumer goods manufacturing. During Q1 2020, containerized trade was greatly impacted by the COVID-19 outbreak. The biggest five USWC ports’ combined share of all containerized import tonnage discharged at U.S. mainland ports fell from 37.9% in Q1 2019 to 33.4% in Q1 2020.13 However, we expect trade volume to recover as an effective vaccine or treatment is introduced globally.
We expect this recent shift in coastal volume will translate even more into stronger returns in the coming years at most large USEC ports.
RECENTLY OUTPERFORMING INVESTMENT PERFORMANCE OF EASTERN U.S. INDUSTRIAL SUBMARKETS
Over the past five years, the industrial NCREIF Property Index (NPI) return for the East region has been gradually accelerating and recently exceeded that of the West region over the past year (Figure 4). Outperforming markets recently have been Trenton, New York, Newark, Orlando, Baltimore, and Boston, all generally linked to large and dense population centers.
FIGURE 4: NCREIF INDUSTRIAL RETURNS BY U.S. REGION
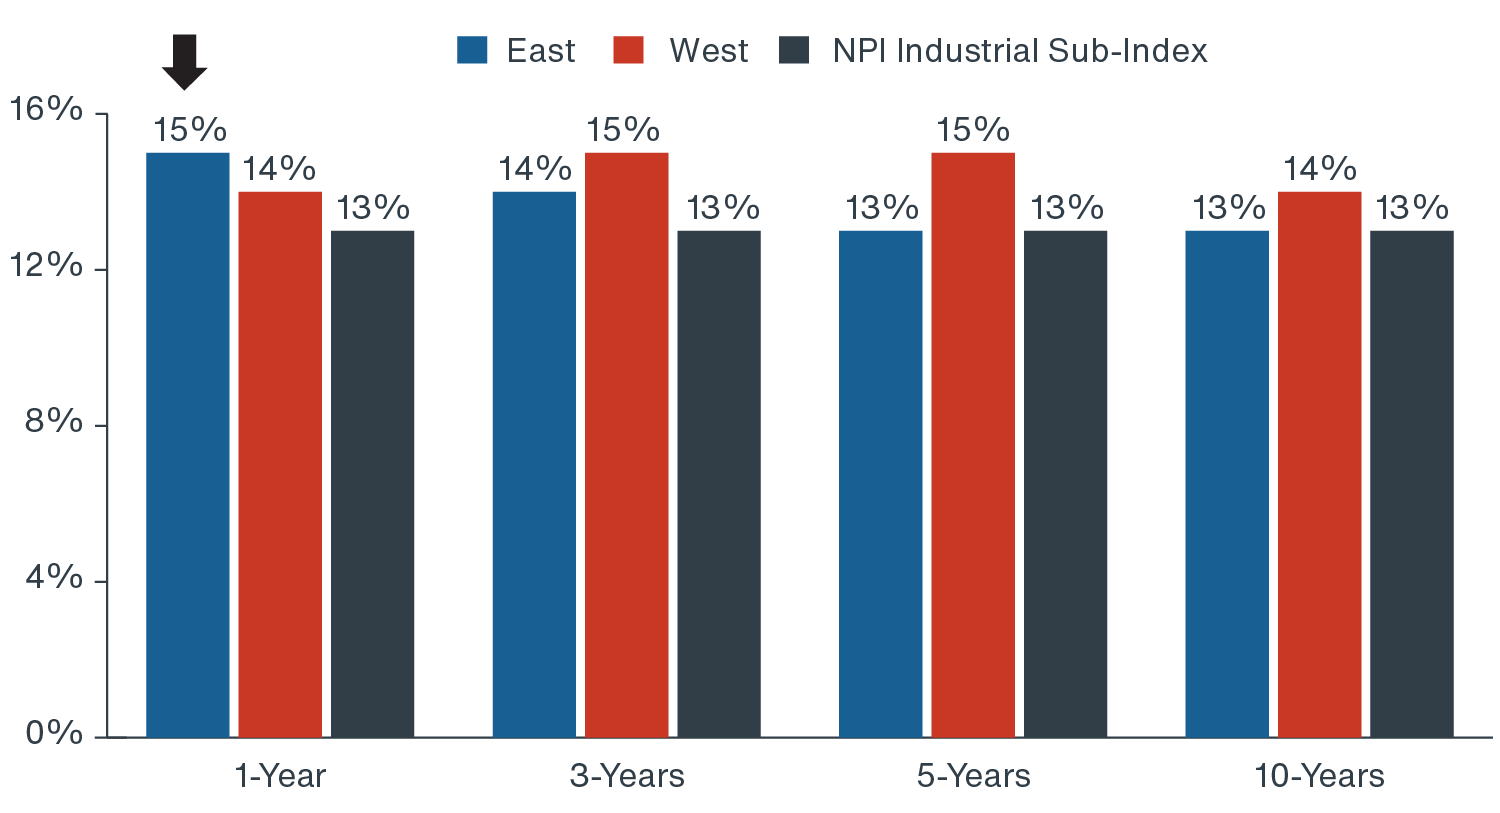
Source: NCREIF, Clarion Partners Investment Research, Q1 2020.
CONCLUSION: STILL MORE GROWTH AHEAD
Over the past decade, U.S. eastern seaborne ports and inland hubs have invested in the necessary infrastructure for new warehouse space in order to boost and sustain trade volumes and generate new economic opportunity and business tax revenue for their respective states. These ports are likely closer to the ultimate destinations of the cargo and, at least for now, have a more attractive cost of doing business. The recent surge in activity at ports in Florida, Georgia, and South Carolina should bode well for future investment returns in these areas, as these states continue to capture more of the U.S. population.
Clarion Partners is optimistic about the long-term demand for industrial property in top U.S. port markets on the East, Gulf, and West Coasts alike, but nonetheless believes that new trade partnerships, routes, and production locations may benefit East Coast industrial hubs to a greater extent.