Prior to the COVID-19 crisis, commercial real estate (CRE) demand and supply fundamentals were largely healthy in most markets and property sectors. The U.S. labor market and household formation had been very strong, driving robust demand for commercial space. Furthermore, relatively conservative underwriting and rising construction costs constrained new supply. In recent months, however, the global pandemic has led to a rapid downturn of the U.S economy, negatively impacting different industries and real estate dynamics.
The COVID-19 crisis and economic fallouts are still developing, and the ultimate impact of the outbreak on the economy and the CRE sector remains uncertain. At this point, we can consider the fundamentals in place before the crisis, and early impacts of the crisis, to analyze how ODCE weightings may shift in response. Clarion Partners believes that the unprecedented monetary and fiscal stimulus programs and the transitory, self-induced nature of the shutdown are factors that will facilitate an economic recovery. Pent-up demand would also encourage a rebound once the outbreak subsides and/or is treatable. Pre-crisis, U.S. CRE had near cycle-low vacancy rates and attractive pricing relative to Treasuries and investment grade bonds, which may help mitigate some negative impacts. More importantly, U.S. financial institutions are not overleveraged, thanks to tighter financial regulations after the global financial crisis (GFC). Currently, the COVID-19 crisis, social distancing practices and changing daily routines, appear to be accelerating some of the important existing trends in CRE, which we expect will influence sector allocation investment strategy.
ODCE INVESTMENT PERFORMANCE
The NFI-ODCE, short for NCREIF Fund Index - Open End Diversified Core Equity, is an index of investment returns of 38 open-end commingled funds reporting since its inception in 1978 on both a historical and current basis (with 24 funds active in the index today). All NFI-ODCE funds pursue a core investment strategy, which is typically characterized by low risk, low leverage (currently at 21.9%), and stable properties diversified across U.S. markets.1
Over the past few years, the ODCE Index has continued to deliver positive but lower returns. The recent moderation has been largely dragged down by the weakening retail sector, while the industrial sector has been very strong. Multifamily and office returns have been solid as well, closer to overall ODCE average total returns.
ODCE Annual Total Returns (As of Q1 2020)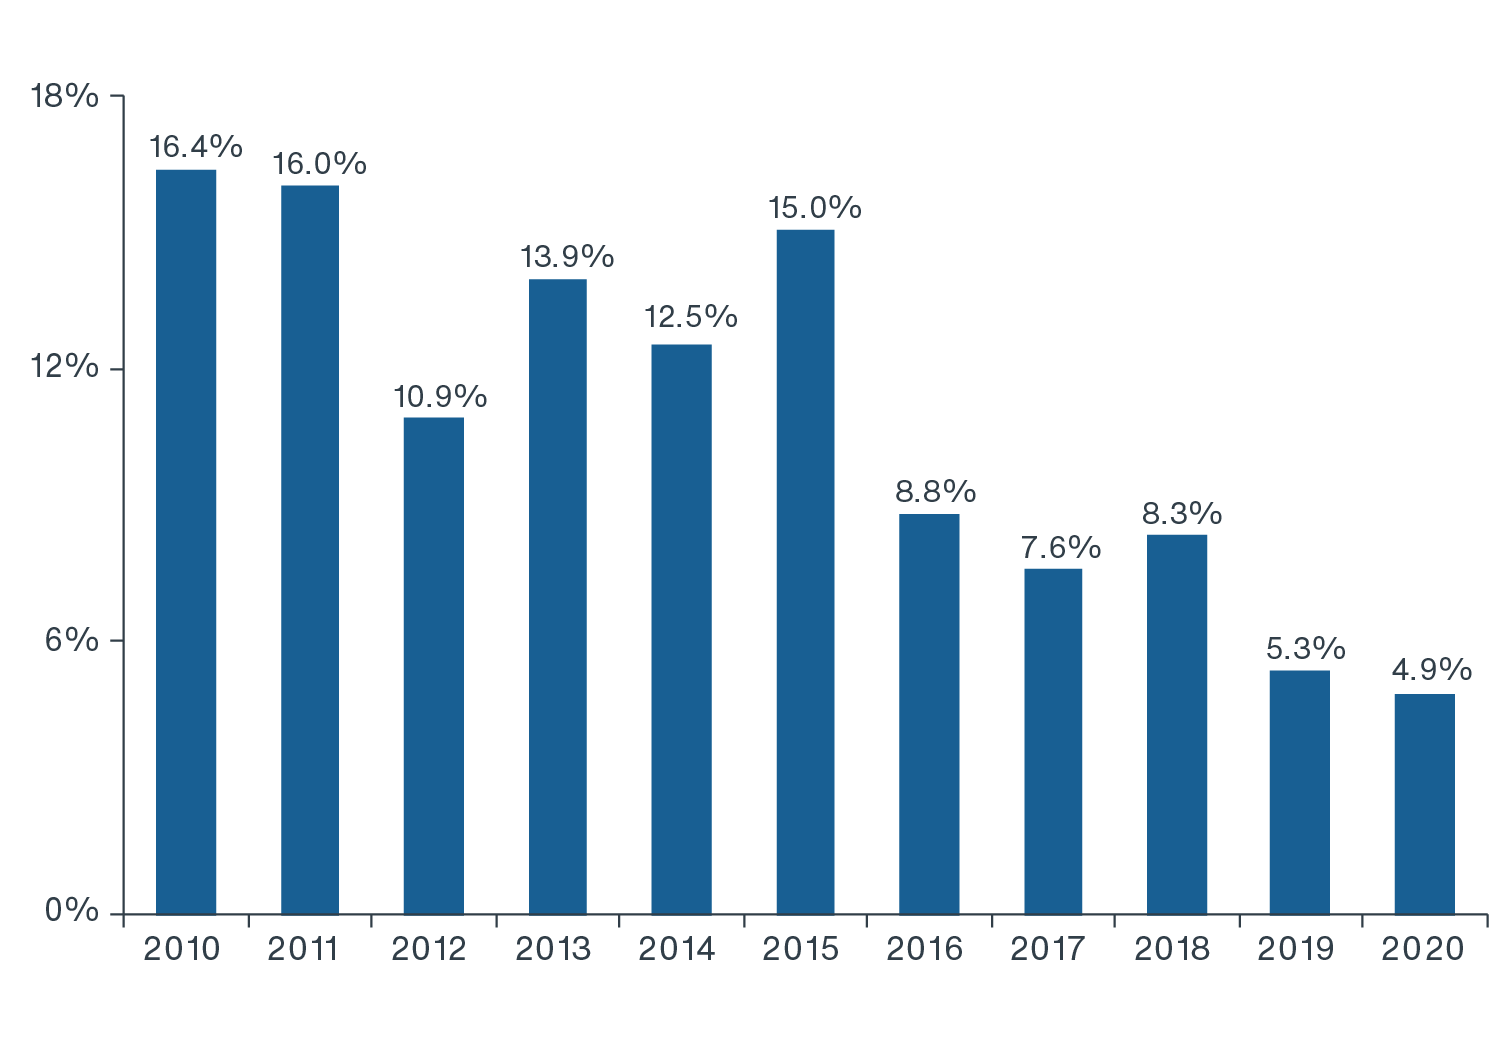
Source: NCREIF, Clarion Partners Investment Research, Q1 2020. Note: ODCE Index total returns are levered and include all property types. The annual total returns are calculated year-over-year as of Q1 each year.
Recent Weakness
Depreciation of Retail. In the prior 42 years, the retail sector has generated the best risk-adjusted returns within the NCREIF Index. Over the past three years, retail asset values have been in steady decline amidst the structural weaknesses seen in the sector, including the e-commerce boom, shifting shopper preferences, ongoing waves of store closures, and recent increases in capital requirements. Factors, including valuation declines and increasing investor allocations to other property sectors, have contributed to a decline in the retail sector allocation to only 16% in the ODCE Index. As the massive impact of the pandemic is absorbed, it will likely move even lower.
Within the retail sector, weights to mall and non-mall retail may vary going forward. Grocery and drug store anchored necessity neighborhood/ community centers have performed comparatively well. On the other hand, mall owners face significant challenges in how to transform tenant mix and boost foot traffic, which would require an enormous amount of CAPEX. Malls account for approximately 1/3 of the ODCE retail exposure and were already in decline pre-COVID-19, which we believe is likely to continue. Furthermore, a lack of natural buyers may also put additional pressure on mall pricing, as large public mall REITS are currently in disarray.
Mark-to-Market Debt. Mark-to-market debt valuation also contributed to the recent weak performance of the ODCE Index. In a rising and falling interest rate environment, outstanding debt at funds with a mark-to-market debt policy (which includes nearly all ODCE funds) would be written up or down, respectively, essentially becoming more or less valuable relative to prevailing rates. Over the past year, the Federal Reserve reversed its monetary policy and reduced the target fed funds rate five times, including two emergency rate cuts in March this year. During this period, the U.S. 10-year Treasury yield fell by 170 bps, from 2.4% to 0.7%.2 Borrowing rates adjusted along with the treasury rate decline and have resulted in a mark-to-market debt value loss of the ODCE Index.
Recent Strengths
Alternatively, the ongoing e-commerce boom has benefited the industrial warehouse sector. In many ways, industrial has become the new retail. Online sales growth is the primary driver of the sector’s significant outperformance (and retail’s substantial underperformance). The diverging performance between industrial and retail is arguably the most stunning development in the NCREIF 42-year history. Over the past year as of Q1 2020, the ODCE Index industrial unlevered return was 12.6% while retail was -4.8%.
ODCE Annualized Total Returns by Sector
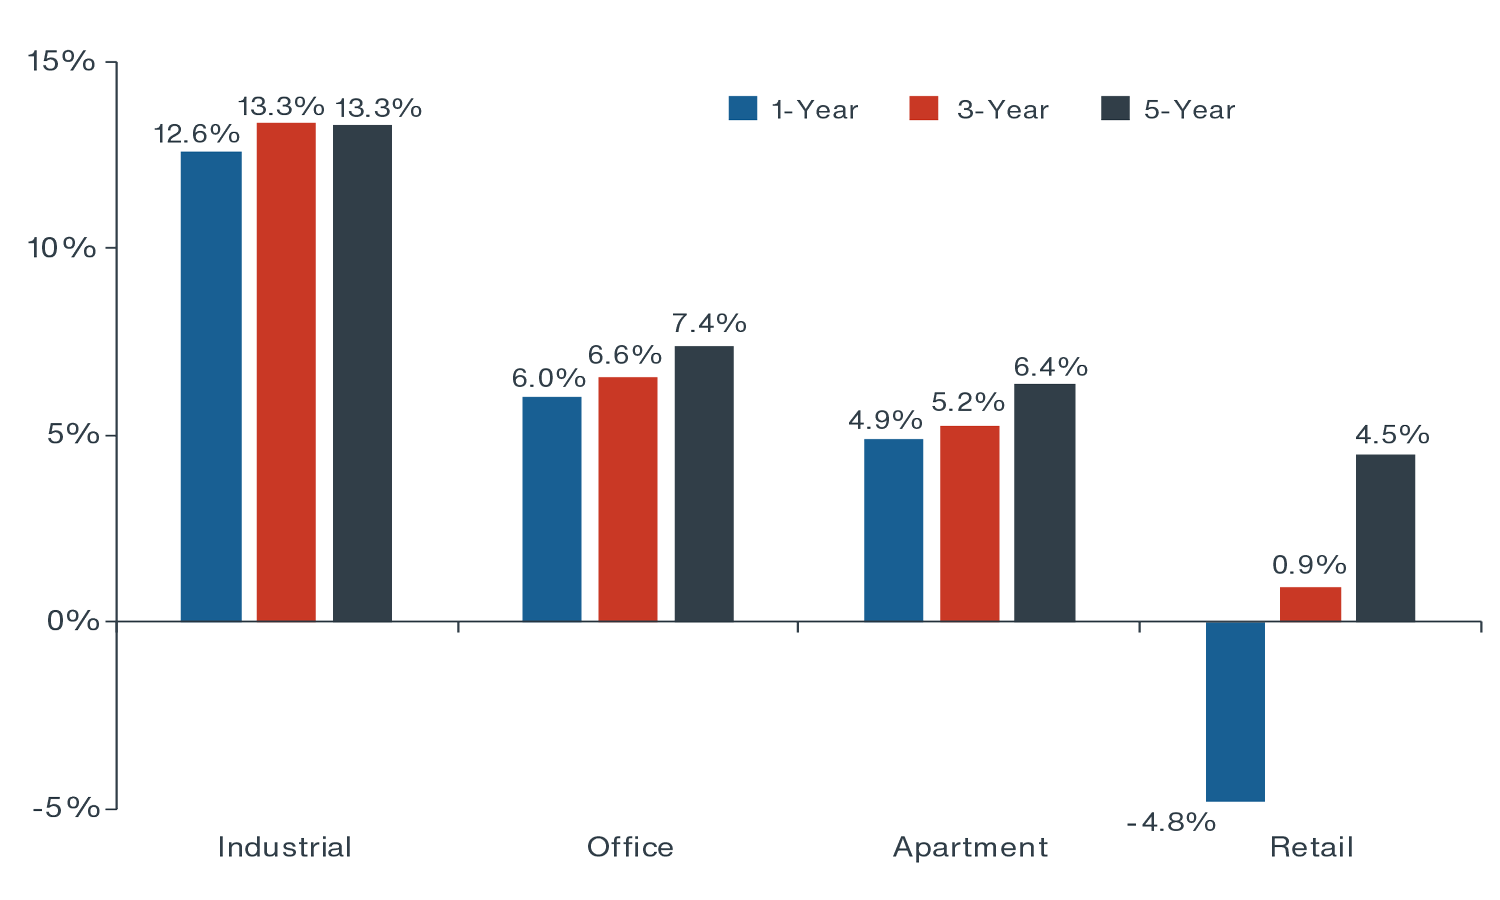
Source: NCREIF, Clarion Partners Investment Research, Q1 2020. Note: The total returns are calculated from all ODCE assets within the NCREIF database and are unlevered.
Over the past 20 years, U.S. e-commerce has grown at an 18.2% CAGR, continuing to gain market share as a percentage of retail sales. Today, e-commerce sales still account for less than 15% of total core retail sales and are forecast to grow to a 30% share by 2030.3 Demand for Class A ware-house and distribution property has remained very strong, and new warehouse space is expected to grow by about 1.6 billion sf through 2025. This is based on the assumption that every $1 billion increase in e-commerce sales effectively requires an additional 1.25 million square feet of new warehouse space.4 According to Adobe Analytics, online sales surged by 49% in April over March, as millions of consumers stayed at home and avoided shopping in stores. It is likely that the COVID-19 crisis and social distancing practices will expand e-commerce market share more quickly.
CORE FUND MANAGERS REBALANCE CRE PORTFOLIOS
Clarion Partners believes that the new omnichannel consumer world is by far the most transformative secular investment theme, and that it is likely that we are less than halfway through building the required infrastructure for continued e-commerce expansion, with several more years to go. Having recognized this dramatic change, many investors are scaling back on retail and increasing industrial sector exposure. Since 2017, the ODCE weighting in retail declined from 20.3% to 16%, while industrial weighting increased from 12.8% to 18.9%.
ODCE Sector Allocation in Recent History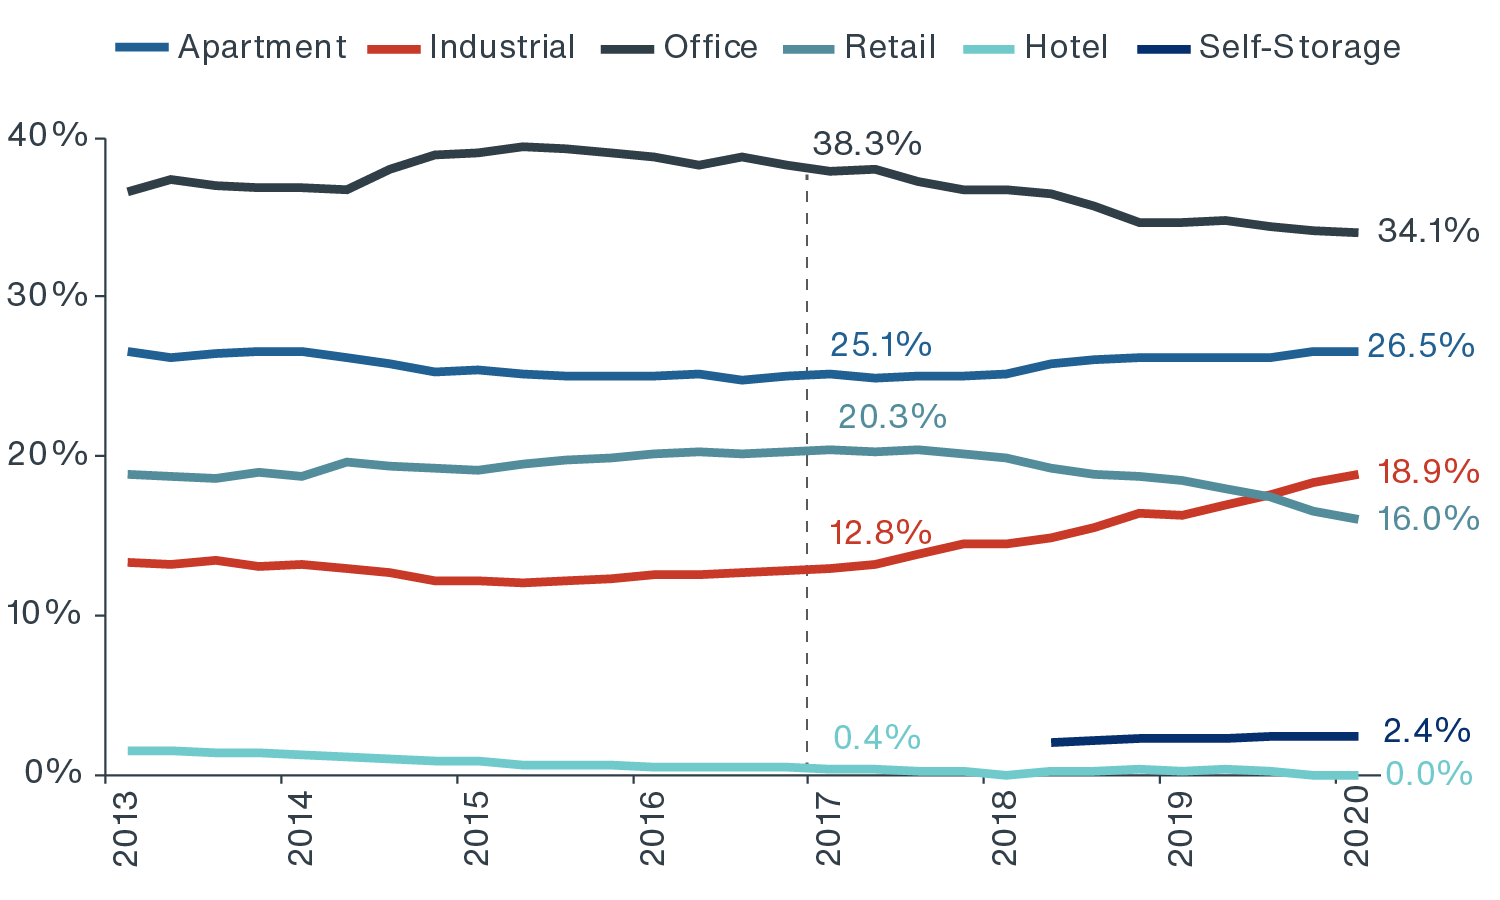
Source: NCREIF, Q1 2020. Note: Data labels of weightings are based on Q4 2016 and Q1 2020.
The ODCE weighting to office has also declined from 38.3% to 34.1% since 2017, reflecting portfolio de-risking, as more investors realize that many office buildings are capital intensive and historically more volatile during recessions. Moreover, the COVID-19 crisis and WFH trends pose new un-certainties about the future demand for office space. For the same risk management reason, the ODCE hotel weighting has been reduced to zero. Hotels tend to be highly volatile during economic downturns, and most investors do not consider hotels a core investment at all.
On the other hand, the ODCE weighting to multifamily has increased from 25.1% to 26.5% since 2017, the second highest share overall, given demographic and socioeconomic tailwinds. This is little surprise because housing is a necessity, and apartments have historically demonstrated better risk-adjusted returns. Current market conditions continue to consist of a low inventory of professionally-managed rental housing (both multifamily and single-family) amidst rising new household formation and high for-sale home prices. We believe institutional investors are likely to continue to allocate capital to Class A and well-located Class B rental housing assets within thriving live-work-play environments, which continue to report very low vacancy levels.
In the years ahead, there is also likely to be stronger interest in alternative property types. More investors are pursuing life sciences, medical office (MOB), student housing, and data centers. Some of these property types exhibit core-like investment characteristics, including relatively stable cash flow, high occupancy, and good liquidity. Self-storage is already 2.4% of the ODCE Index. We believe that the ODCE allocation to alternative property types will increase in years ahead.
CONCLUSION
Looking forward, the COVID-19 crisis is likely to accelerate several of the existing themes in real estate, including the continued rise of industrial and the fall of selected retail (mainly, malls and big-box heavy power centers). To date, as property sector fundamentals and investment performance have continued to diverge, ODCE fund managers have taken notice, and this is reflected in current weightings. We believe that pre-COVID fundamentals, combined with preliminary impacts of the pandemic, may lead to the following shifts in ODCE weightings:
- Industrial’s ongoing rise;
- Retail will continue to slide;
- Allocations to multifamily will increase, and office should drift lower gradually; and
- Gradual growth in aforementioned alternative property sectors from current levels will occur.
Increasingly risk-averse institutional investors have favored Class A property in supply-chain logistics, rental housing, and health care.5 Top investor priorities have been stable cash flows, strong credit tenancy, adaptable omnichannel businesses, urbanization outside of big city CBDs, the out-performance of certain regions, and aging demographics. For these reasons we expect to see a strategic adjustment in sector allocation, to reflect the shifting investment themes, which may help enhance portfolio performance while reducing potential risks.