Executive Summary
Against a backdrop of strong demographic tailwinds and technological advancement, outpatient medical buildings, commonly referred to as medical office buildings (MOBs), are increasingly viewed as a strategic allocation within commercial real estate portfolios.
Supporting this outlook are these key developments:
- Demographic drivers, fueled by the aging Baby Boomer cohort and the anticipated continued rise in healthcare spending, will support elevated demand for healthcare services and outpatient medical space.
The continued evolution of care delivery, driven by ongoing technological advancements as well as healthcare systems’ desire to control costs, has enabled complex procedures and surgeries to be performed in outpatient settings while still achieving desirable outcomes.
Greater emphasis on localized care, as patients prioritize convenience and proximity, is driving providers to move services closer to where patients live.
Sticky tenancy, wherein occupiers invest meaningful capital alongside building owners, results in long, predictable leases and cash flow from a creditworthy sector.
INTRODUCTIONMOBs are designed for healthcare services that do not require overnight stays in the hospital. They typically facilitate:
- Physician practices (primary care and specialists)
- Diagnostic imaging (MRI, CT, X-ray)
- Outpatient surgery centers
- Lab services
- Urgent care clinics
- Physical therapy clinics
Institutional investors, driven by the pursuit of solid and dependable cash flow streams and attractive risk-adjusted returns continue to seek to allocate capital to defensive sectors with powerful secular tailwinds.
Several important structural drivers are key tailwinds for the MOB sector. These include a substantial demographic development in the form of an aging Baby Boomer population and the associated rise in healthcare spending, as well as an increasing number of procedures and service lines being targeted for outpatient settings, and hospitals seeking margin expansion while facing rising costs.
AGING BABY BOOMER COHORT EXPECTED TO PROPEL MEDICAL CARE DEMAND
The aging demographic profile in the U.S. is increasing healthcare utilization and supporting demand for MOB space.
The long-awaited “silver tsunami” has started to accelerate in the U.S., with demographics shifting to an older population profile. At the same time, medical breakthroughs in chronic disease management and prevention, improvements in emergency care, behavioral shifts, and health-conscious dietary habits have improved longevity outcomes.
The 65+ population has seen significant growth in the U.S. over the past four decades, a trend expected to accelerate further over the next ten years (Figure 1). The 65+ population has more than doubled since 1990, from 31 million to 63 million (17% of the total population), accounting for 37% of all personal healthcare spending. This cohort is projected to reach over 74 million by 2035.
Within that group, the 85+ cohort has not only kept pace but now makes up a larger share of the elderly population (65+), increasing from 9.8% of the group in 1990 to 10.5% today, and consuming three times as much healthcare per person as those aged 65-74. By 2035, the 85+ cohort is expected to make up 13.3% of the elderly population in the U.S.
FIGURE 1: POPULATION TRENDS FOR AGES 65-84 AND 85+ (MILLIONS)
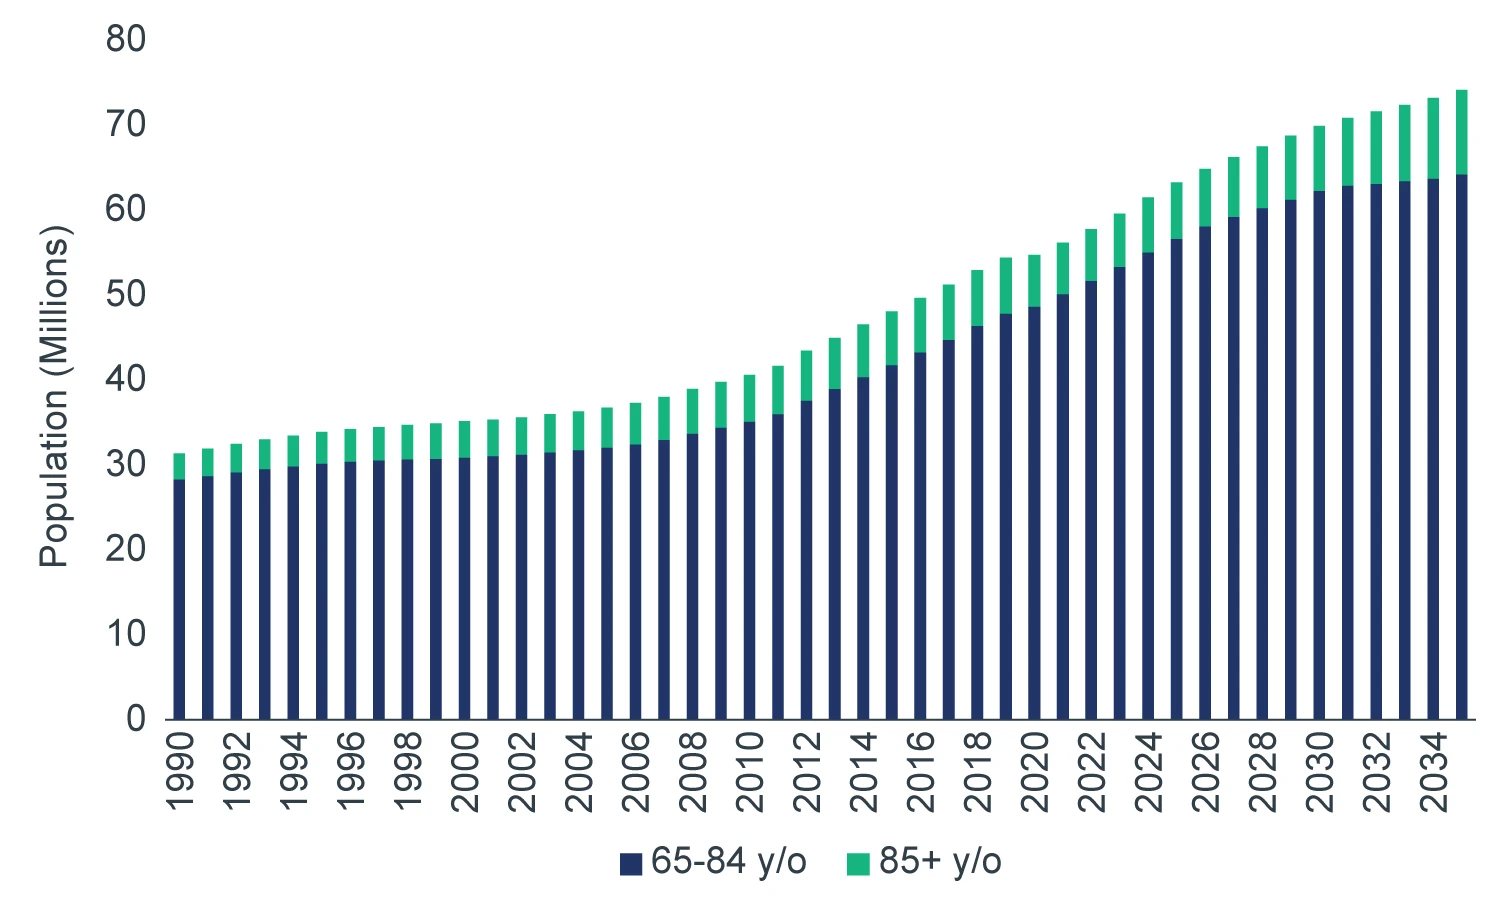
Source: U.S. Census Bureau (BOC); Moody's Analytics Forecasted. March 2026.
As more individuals live into their 70s and 80s, demand increases for:
- Chronic disease management (cardiology, oncology, and endocrinology)
- Orthopedics (joint replacements increase with age)
- Imaging and diagnostics
- Post-acute rehabilitation services
While there are investment risks, including provider consolidation affecting tenant bargaining power, MOB demand is primarily driven by age cohort growth and underlying healthcare utilization needs, which are durable, long-term drivers.
Beyond MOBs, these same demographic trends also support demand for adjacent healthcare real estate sectors, such as inpatient rehabilitation facilities (IRFs) due to an anticipated rise in acute hospital admissions related to geriatric conditions (e.g., stroke, joint replacements, and orthopedic injuries). Demand for IRF beds is also being driven by the shift to value-based reimbursement, as providers are incentivized to reduce hospital length of stay and minimize readmissions.
While only 29% of IRFs in the U.S. are freestanding facilities, compared to 71% that are in acute care hospitals, they account for 55% of discharges, indicating that freestanding IRFs have higher patient throughput and utilization. They also have higher operating margins due to several factors that drive greater cost efficiency, including more specialized staffing models, optimized length of stay and lower capital intensity.
AN ONGOING SHIFT TO MOBs
When clinically appropriate, procedures performed in MOBs are less costly for health systems and providers. For example, the average cost per surgical procedure in an ambulatory surgery center is approximately $3,157, compared with $7,716 in a hospital outpatient department.1
Migration toward MOBs has been facilitated in part by improvements in medical technology (Figure 2). Innovations such as minimally invasive robotics and electronic health records have paved the way for greater utilization of ambulatory surgery centers (ASCs), while advancements in portable imaging tools have increased the prevalence of outpatient procedures in cardiology, oncology infusion, and medical imaging. Reflecting this trend, eight of the ten fastest-growing healthcare service lines over the next five years are expected to be outpatient.2
FIGURE 2: OUTPATIENT VISITS RISE AS INPATIENT DAYS DECLINE (1999-2024)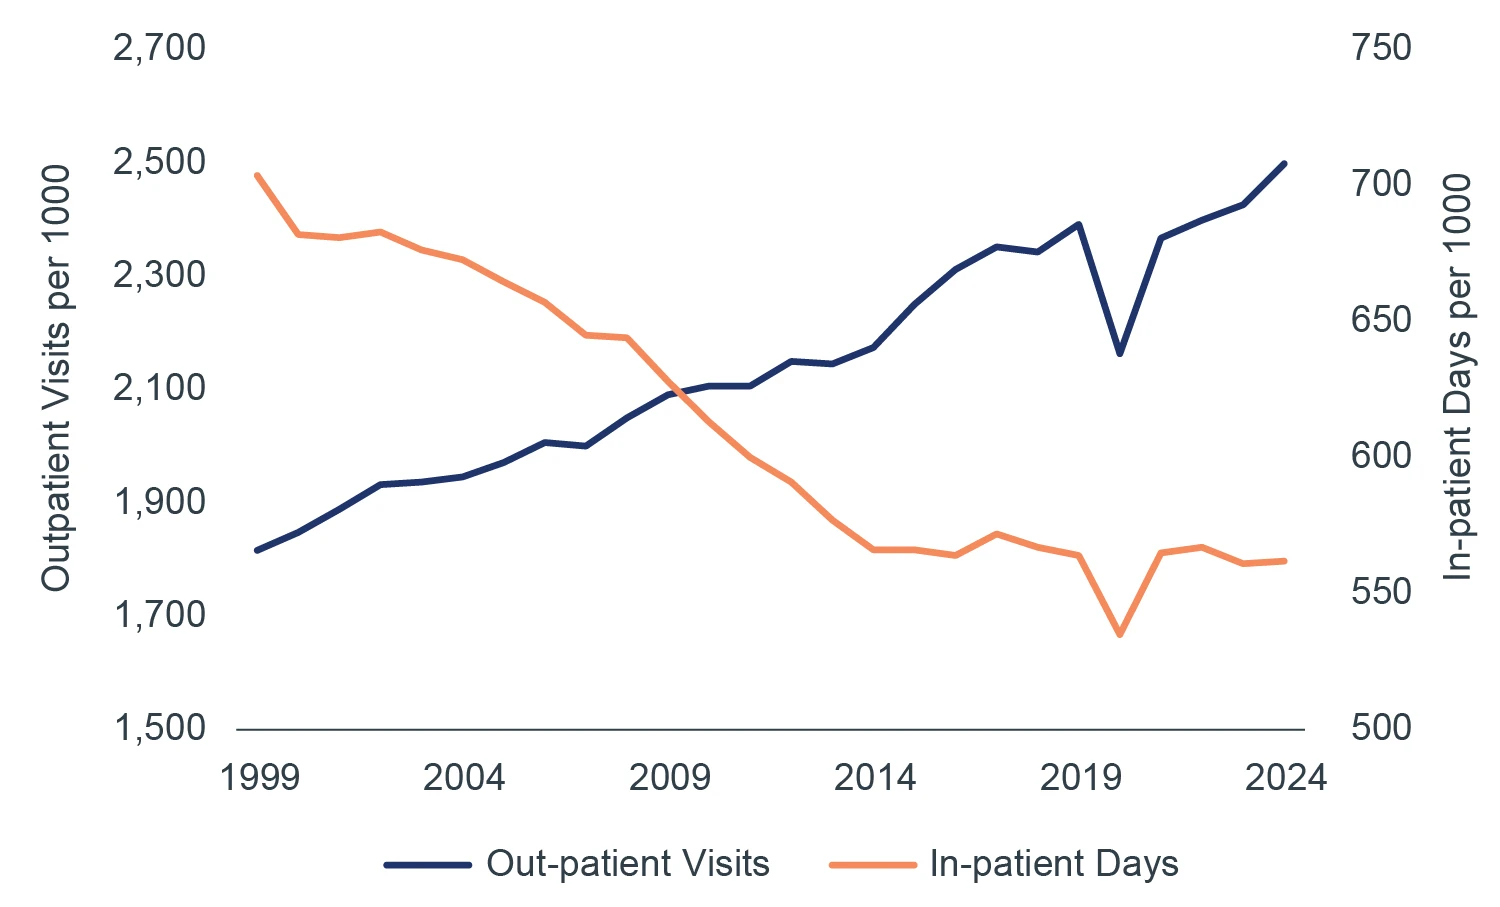
Source: KFF: Hospital Outpatient Visits per 1,000 Population by Ownership Type. 2025.
To bring points of care closer to patients, health systems have adopted a hub-and-spoke model. In this structure, MOBs and post-acute facilities are located near major hospitals (both on and off campus), while hospital beds are reserved for highly acute cases requiring prolonged, in-person monitoring. Site selection is driven by referral patterns, supporting an MOB tenant base that serves patients who prioritize convenience and proximity across the broader care ecosystem.
Real estate is a major capital component of health systems, historically estimated at ~40% of the balance sheet,3 and continues to represent ~15-20% of operating costs today.4 As margin pressures push health systems to pursue cost efficiencies, providers continue to monetize non-core real estate holdings while also investing in modern outpatient medical buildings to maintain strategic control of their footprint, improve patient access, and capitalize on the ongoing shift toward outpatient care.
HEALTHCARE SPENDING REMAINS STRONG
U.S. healthcare spending has historically grown faster than GDP for decades, and long-term projections suggest this trend will persist, driven by aging demographics and chronic disease prevalence.
Spending in the sector is projected to grow at an average rate of 5.8% per year over the coming decade, up from 5.5% over the past decade (Figure 3). On a per capita basis, it is roughly double that of other developed nations and comprised 18% of U.S. GDP in 2024.5
FIGURE 3: U.S. HEALTHCARE SPENDING CONTINUES UPWARD TRAJECTORY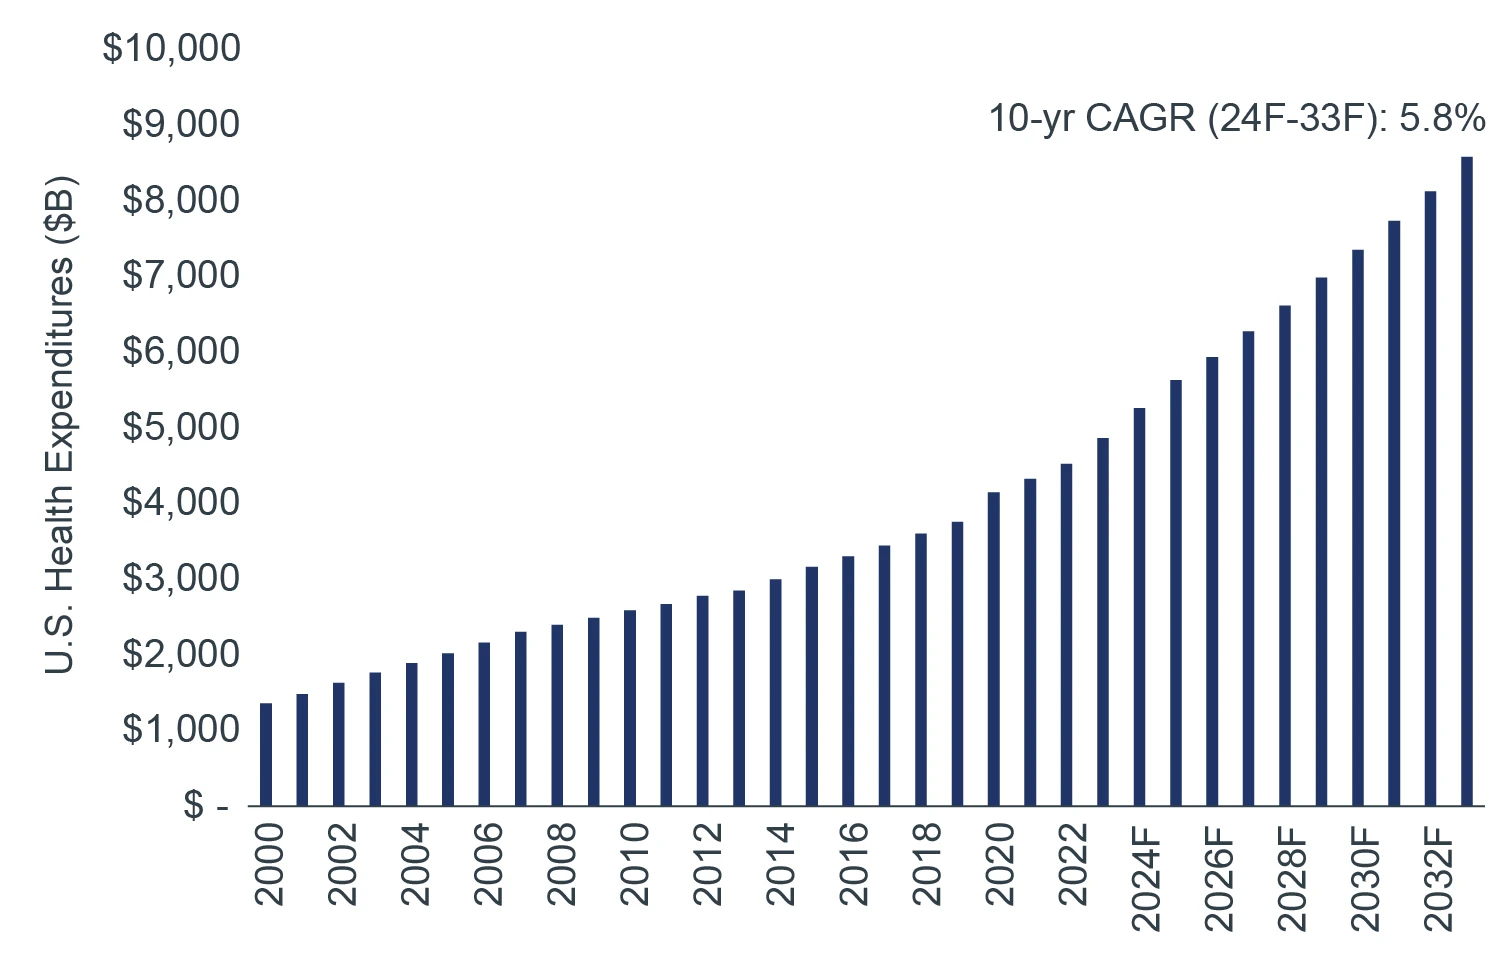
Source: Centers for Medicare & Medicaid Services (CMS). National Health Expenditure Data. 2024.
Growth in long-term healthcare expenditure also supports stable occupancy, strong, sticky tenant demand, and longduration cash flow, reinforcing the MOB sector’s reputation as a defensive asset class.
A PILLAR OF STRENGTH
To get an idea of how defensive this sector is, one does not have to look any further than its risk-adjusted returns relative to traditional property sectors (Figure 4).
Over the past 10 years, outpatient medical has outperformed the all-property NPI benchmark on a risk-adjusted basis. Apart from the industrial sector, outpatient medical outperformed all traditional property sectors over the same period.
FIGURE 4: 10-YEAR RISK-ADJUSTED RETURNS BY PROPERTY SECTOR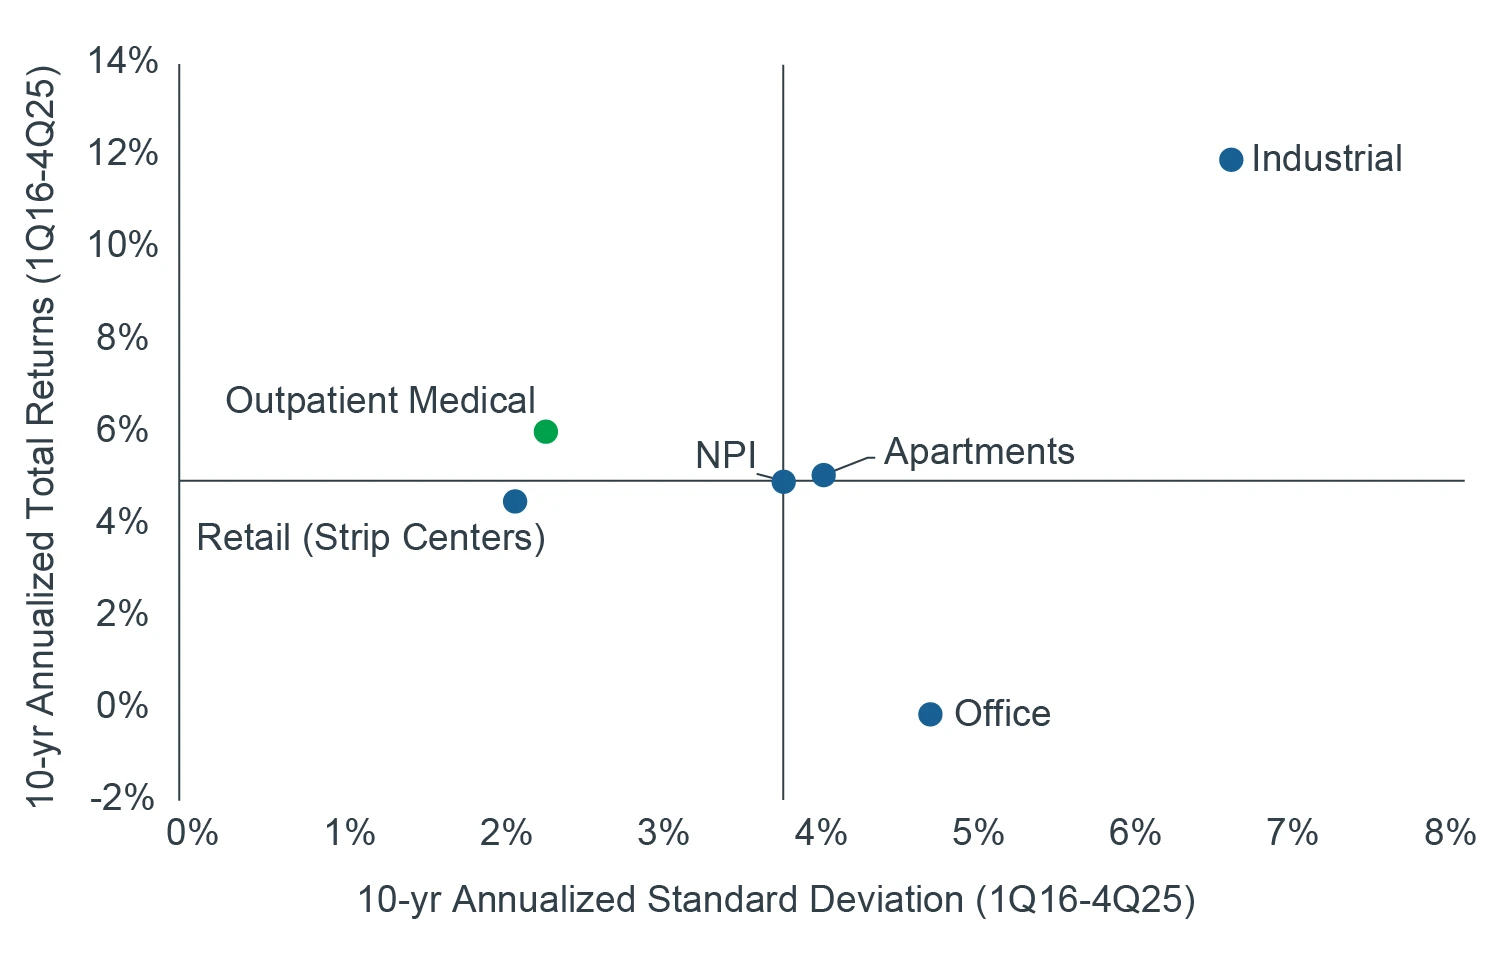
Source: NCREIF, as of 4Q25.
The sector’s historically low volatility reflects tenant “stickiness,” longer lease terms relative to other property sectors, and limited speculative development, as most MOB construction is pre-leased.
The expense and disruption associated with relocation, including the cost of highly specialized buildouts, hospital affiliations, and potential impacts to patient convenience and loyalty, contribute to this tenant stickiness. Retention rates often surpass 80%, with lease terms typically ranging from 7 to 10 years and extending beyond 20 years for highly specialized facilities.
In addition, the healthcare sector’s tenant base exhibits some of the strongest credit profiles. Healthcare has one of the highest shares of bonds rated A- or higher across sectors (48%), second only to financials (68%) and ahead of utilities (48%), consumer staples (44%), and industrials (40%).6 Employment in the sector continues to outpace other industries.7
It is also worth noting that MOBs have proven resilient over the past decade. During the COVID-19 recession, which began in Q2 2020 and is widely considered the deepest global economic downturn since World War II, GDP declined by 9.5% year over year. Despite this, MOB tenant occupancy remained stable at approximately 91–92% from 2019 through 2021, with no meaningful disruption.8
For these reasons, we believe that outpatient medical is both a meaningful risk ballast within a diversified real estate portfolio and a durable contributor to returns, supported by stable structural demand drivers.
CONCLUSION
The aging of the massive Baby Boomer cohort, combined with the ongoing shift to outpatient care settings driven by innovation and healthcare providers’ need to control costs, is expected to result in elevated demand for MOB space going forward. The forecasted growth in the older age cohorts over the coming decade presents potential upside to the sector’s outlook and anticipated performance relative to prior real estate cycles.
Supported by demographic growth, needs-based demand drivers, and historically attractive risk-adjusted returns, rising institutional demand for MOB assets should further support the sector’s performance going forward.