INTRODUCTION
The ongoing and rapid growth in the U.S. Sun Belt has been an extraordinary boon to commercial real estate investors. The region stretches across eighteen states in the Southeast and Southwest and includes seven of the ten largest U.S. cities, as well as many mid-size metropolitan statistical areas (MSAs).1 The Sun Belt now holds about 50% of the national population (335 million), which is expected to rise to about 55% by 2040.2 Over the past decade, the region accounted for 80% of total U.S. population growth (12 out of the total 15 million).
FIGURE 1: THE SUN BELT REGION & MAJOR CITIES
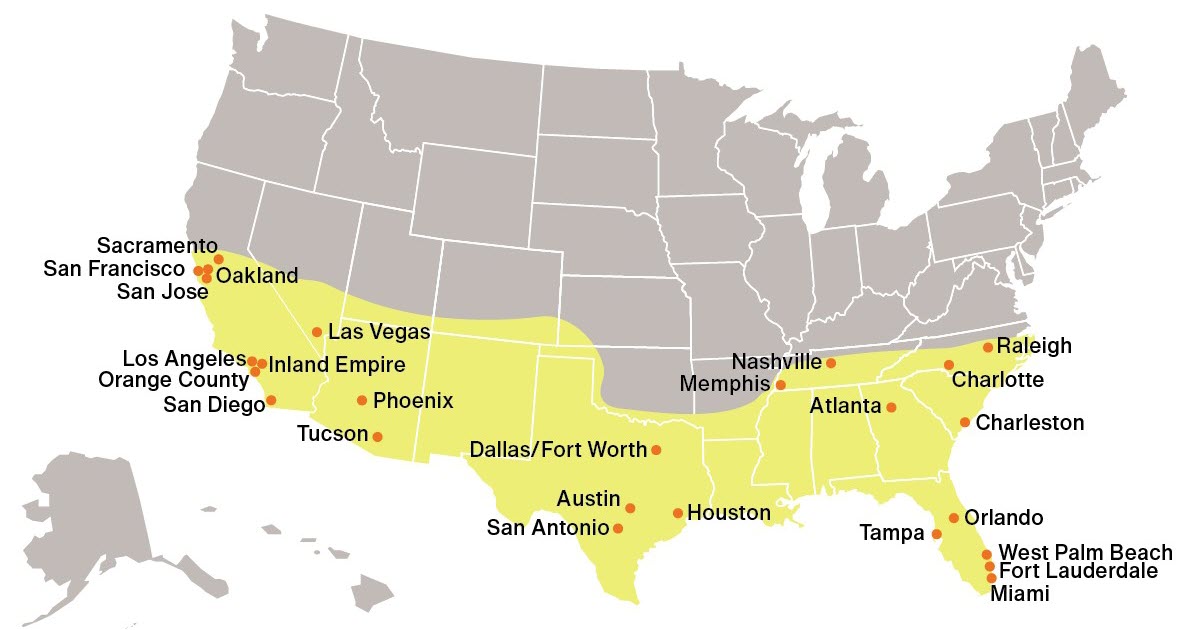
Source: Moody’s Analytics, Q1 2024. 1) The Sun Belt region analysis is based on the totals from the 18 states it spans. 2) There are 27 markets with a population over or near 1 million, and the seven largest cities are Los Angeles, Houston, Atlanta, Dallas, Phoenix, San Francisco, and Riverside.
Over the next decade, Sun Belt population growth is expected to remain steady growing by another 11 million (+7.3%), whereas non-Sun Belt states are forecasted to rise by only 475,000 (+0.3%).3 All ages are drawn to the area for its business-friendly environment, lower cost of living, quality of life, and mild climate. Clarion Partners anticipates the ongoing rise in both workers and residents will continue, from both in-migration and natural births, driving the expansion of live-work-play environments.
FIGURE 2: SUN BELT POPULATION GROWTH OUTPERFORMANCE
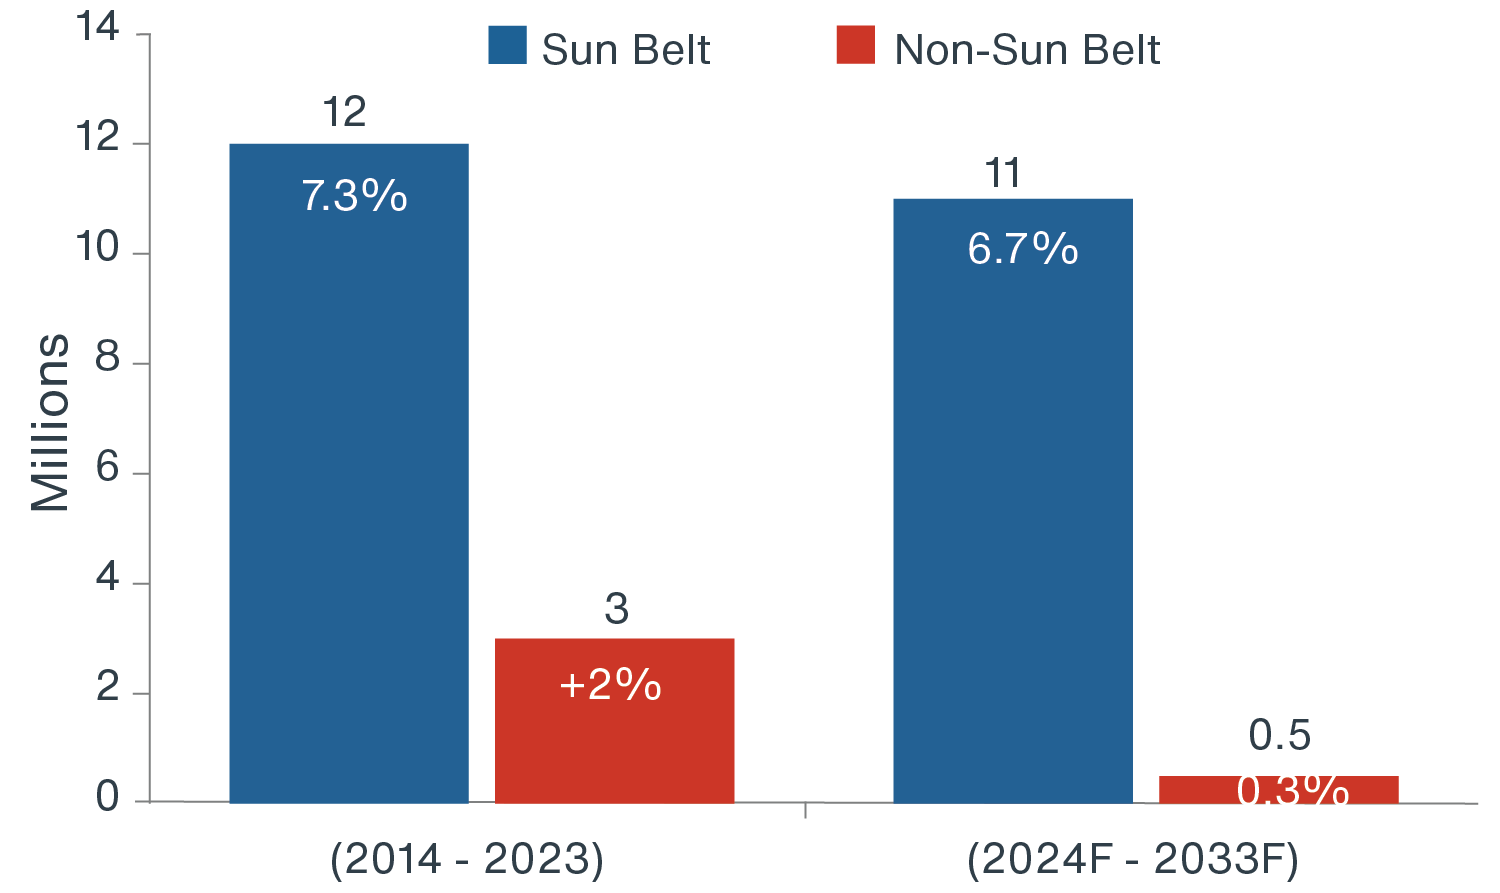
Source: Moody’s Analytics, Clarion Partners Investment Research, April 2024. Notes 1) Based on population totals from the 18 Sun Belt States. 2) The U.S. population in 2023 is 335 million. 3) Through 2033 Texas, Florida, and Arizona have been forecasted to grow by 3.5, 2.6 and 1.1 million, respectively.
REGIONAL GROWTH IN HIGH & LOW TAX STATES
The Sun Belt boom is primarily driven by a higher quality of life including lower taxes, housing, and pleasant weather. Overall, the region offers either low or no corporate, individual, or property taxes, unlike many non-Sun Belt states further North, where the burden is increasingly onerous to many businesses and households. The regional influx by people and corporations is motivated generally by greater economic opportunity and affordability. Within the Sun Belt, California is the main outlier, given that it has both high taxes and domestic outmigration; however, it also has a dynamic labor market with many vital industries.
Over the past decade, national relocations to the Sun Belt, measured by domestic migration, totaled nearly 5 million, largely driven by outflows from the non-Sun Belt region, in particular, states in the Northeast and Midwest. Both regions recently reported comparable international migration and natural population growth (births minus deaths), but it is likely that non-Sun Belt states' population growth will be driven more by international in-migration in the future.4
FIGURE 3: 10-YEAR CUMULATIVE DOMESTIC MIGRATION BY SELECT STATE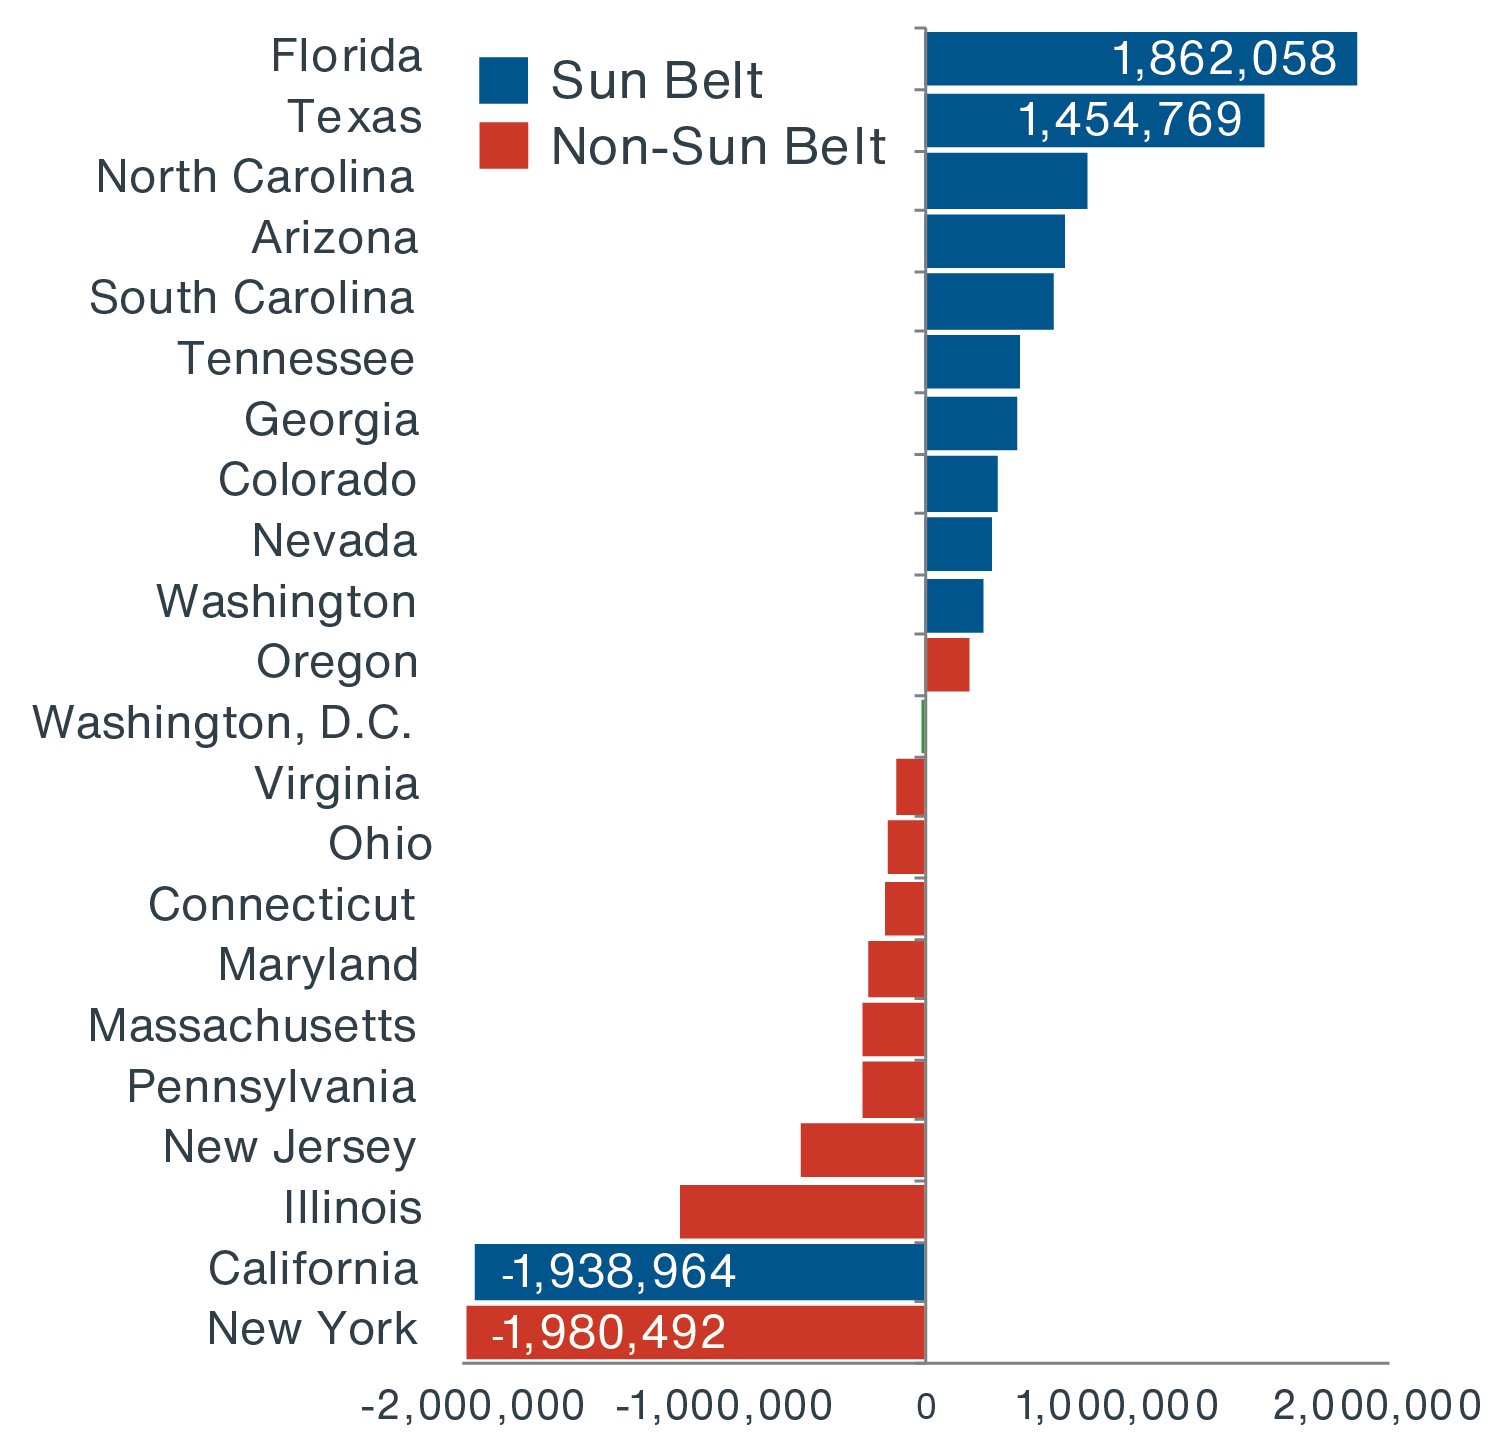
Source: Moody’s Analytics, Clarion Partners Investment Research, Q4 2023. Notes: 1) Total growth the sum from 2013 to 2023.5
Looking ahead through 2033, the overall surge in population should continue in Texas, Florida, Arizona, North Carolina, and Georgia.6
Given recent expansion trends, future growth is also likely to take place in a handful of mid-sized cities. For example, Austin, Raleigh, Orlando, Jacksonville, Dallas, Nashville, Charlotte, Charleston, San Antonio, and Fort Worth have reported sizable gains over the past ten years, which should persist in the future.
FIGURE 4: SUN BELT REGION: TOTAL POPULATION & GROWTH HISTORY/FORECAST
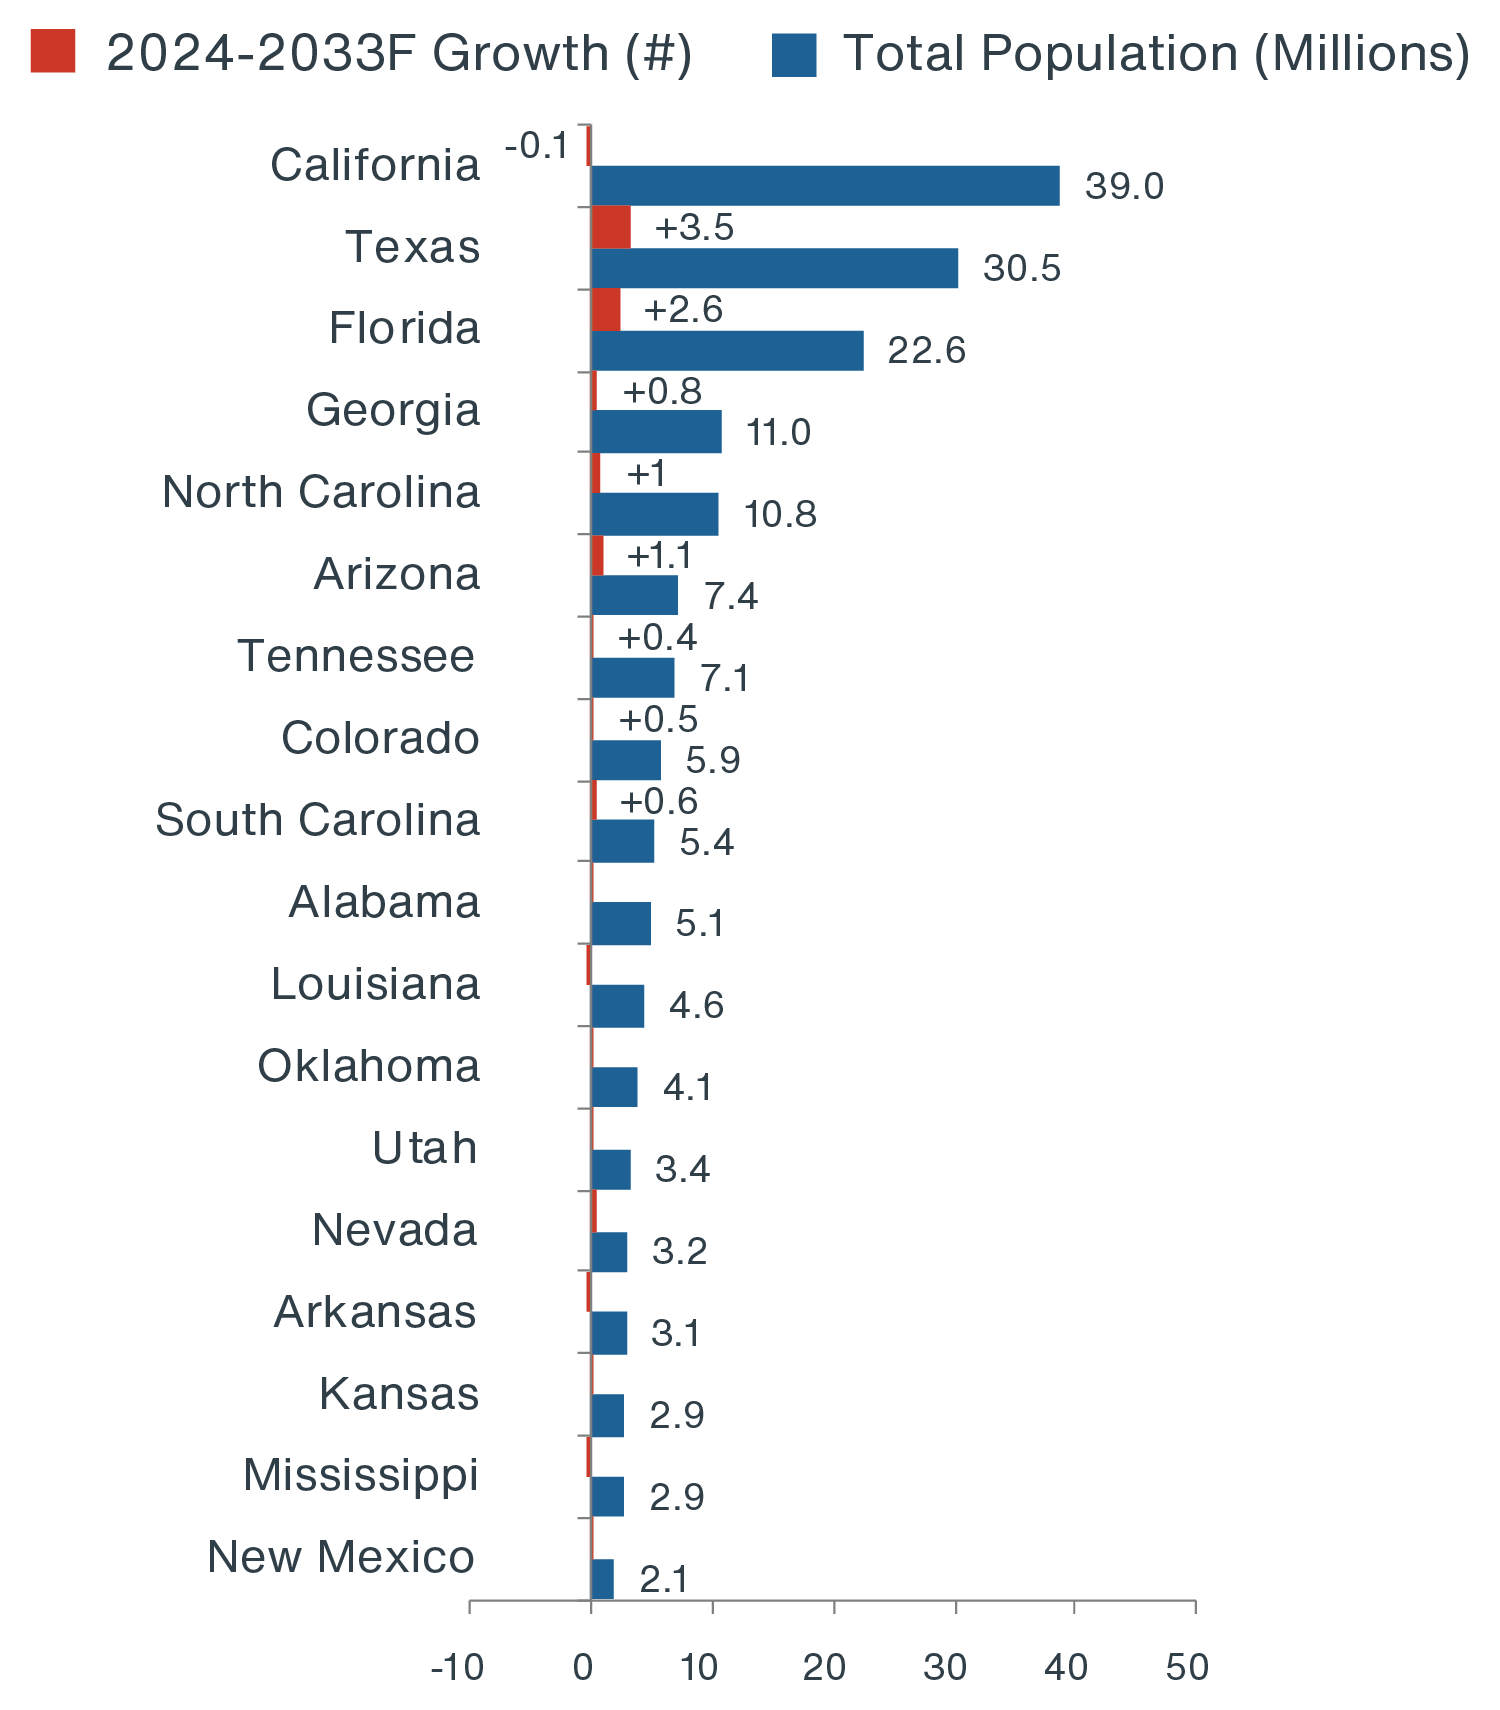
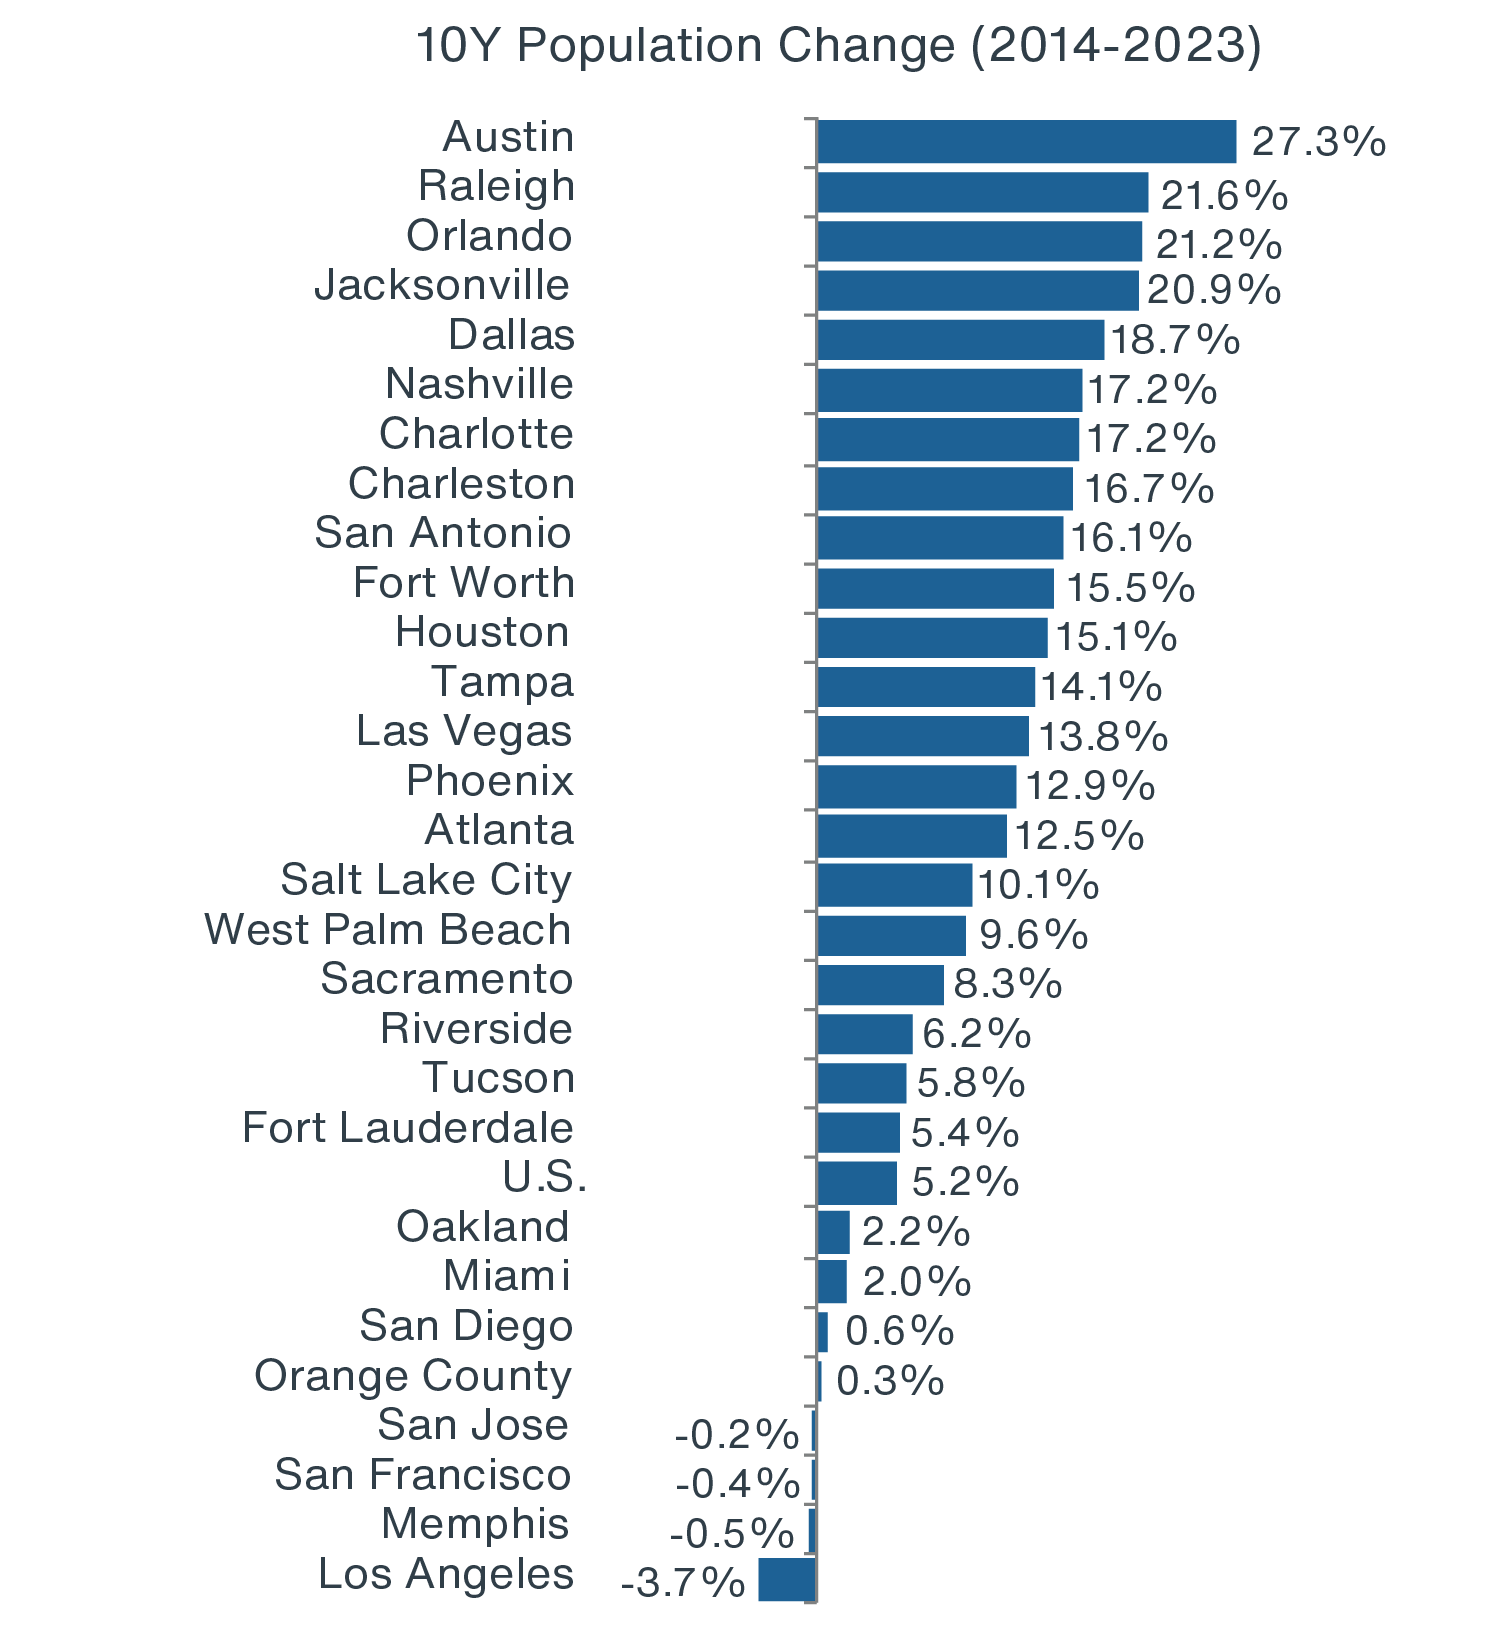
Source: Moody’s Analytics, Clarion Partners Investment Research, Q4 2023. Note: Population is as of 2023 and growth is from 2014-2023.
SIGNIFICANTLY BETTER BUSINESS SETTING LEADS TO PRIVATE SECTOR GROWTH
Lower Taxes a Win-Win. An evergrowing number of companies are domiciled in the Sun Belt. A pro-business culture, largely enabled by fewer and less onerous taxes and regulations, has spurred significant private sector growth. Today, Texas, Florida, and California boast the most Fortune 500 Companies outside of New York, Illinois, and Ohio.7 Over the past decade, total employment in the Sun Belt region grew by 13 million (+20%) versus 6 million (+9%) in non-Sun Belt areas. Furthermore, reduced state and local tax (SALT) and mortgage interest deductions no longer favor homeownership in high-cost states like California, New York, and New Jersey.
Strong Job, GDP & Wage Growth. Tremendous business expansion has led to faster job, GDP, and wage growth in most metro areas, well above the U.S. and non-Sun Belt averages. Recent and forecasted office-using job growth is highest in Austin, Charleston, Dallas, Raleigh, Orlando, Tampa, Miami, West Palm Beach, Nashville, Jacksonville, and Charlotte.8 Muted economic growth, high housing costs, congestion, and dated infra-structure also may worsen prospects for states outside of the Sun Belt.9
Increasingly Younger Work Force. About half of the total nonfarm and office-using jobs (a respective 158 million and 35 million) are already located in the Sun Belt. Also, 52% of Millennials currently live in the region. Millennials as a percentage of the population are now highest in Austin, Denver, Salt Lake City, San Diego, and San Jose.10 With Millennials expected to be about 75% of the workforce by 2030, we expect Sun Belt markets will continue to capture more jobs as their younger populations continue to grow.11
Tourism A Large & Growing Force. Over half of leisure and hospitality jobs are located in the Sun Belt, with California leading by a large margin, followed by Texas and Florida, (three of the five “Sand States"), along with Nevada and Arizona. A variety of other Sun Belt tourist hubs are expected to continue to thrive. Hotel accommodations also offer geographic variety and flexibility in an increasingly mobile world.
MILLENNIALS: IN PURSUIT OF A BETTER QUALITY OF LIFE
Shifting Destinations for Millennials & Recent College Grads. Traditionally, New York, Boston, Washington, D.C., and San Francisco have drawn the majority of recent college grads, but the high-cost and low quality of life in these large metros are driving more young people to mid-sized cities in the South and West.12 These areas also have thriving energy, tech, new media, entertainment, hospitality, health care, and financial services industries.
More Affordable Housing Overall. Major Sun Belt cities have typically reported much lower median home and apartment rent prices, although both have risen in recent years along with the U.S. median price, which is now about $400,000. Most areas in the region are still cheaper by comparison to the gateway cities, and such relative affordability may become more important as young adults age, marry, and have families. Prices in the other major Sun Belt cities generally range between $311,000 and $450,000, which is a notable increase from five years ago but still relatively low. California, Texas, and coastal Florida have also become increasingly expensive. Top cities in California report a median home price between $548,000 and $1.8 million. Available and developable land varies greatly by city and region as well.13
Homeownership Rate A Mixed Story. Surprisingly, many cities in the Sun Belt, such as Los Angeles, San Jose, Austin, San Diego, Miami, and Houston have a lower homeownership rate than the national level (65.9%), ranging between 50% and 60%. This suggests there is still a scalable investment opportunity in rental housing in these cities, as well as those reporting a high percentage of Millennials. Cities in the region leading in homeownership are now Nashville, Raleigh, Jacksonville, Charlotte, and Phoenix.14
SENIORS & RETIREES: SAFE HAVEN FOR RAPIDLY INCREASING AGING POPULATION
Accelerating Growth of Senior Cohort. Today seniors account for about 18% of the U.S. population, a share that is expected to rise to about 21% by 2030. The Sun Belt now holds about 50% of the age 65-plus cohort nation-wide.14 Over the next decade, Orlando, Phoenix, West Palm Beach, Austin, Jacksonville, Fort Lauderdale, Tampa, and Charleston are forecasted to be the fastest-growing retirement areas.
More Than Half of All Purpose-Built Senior Housing Is In Warmer Climates. Over 50% of all age-restricted and senior housing inventory is located in the Sun Belt.15 Demand for professionally-managed, specialty rental housing catering to the elderly should only continue to grow. While homeownership levels are much higher for the 65-plus cohort, these have recently declined. We expect many older Americans will sell long-time homes to generate additional income and reduce housing-related expenses and rent more frequently, whether it be in non- or purpose-built housing. This trend is already well underway.
SUN BELT COMMERCIAL REAL ESTATE OPPORTUNITIES
In recent years, Sun Belt markets have greatly outperformed in effective rent growth relative to outside markets.
The built environment in the region is largely composed of lower-density suburbs and exurbs. Much of the real estate is newer and low-rise construction. Given the higher level of sprawl, the trends toward densification and live-work-play are going strong. At the same time, the fastest-growing markets were largely suburban.16
FIGURE 5: SUN BELT VS. NON-SUN BELT RENT GROWTH HISTORY (5-YEAR)
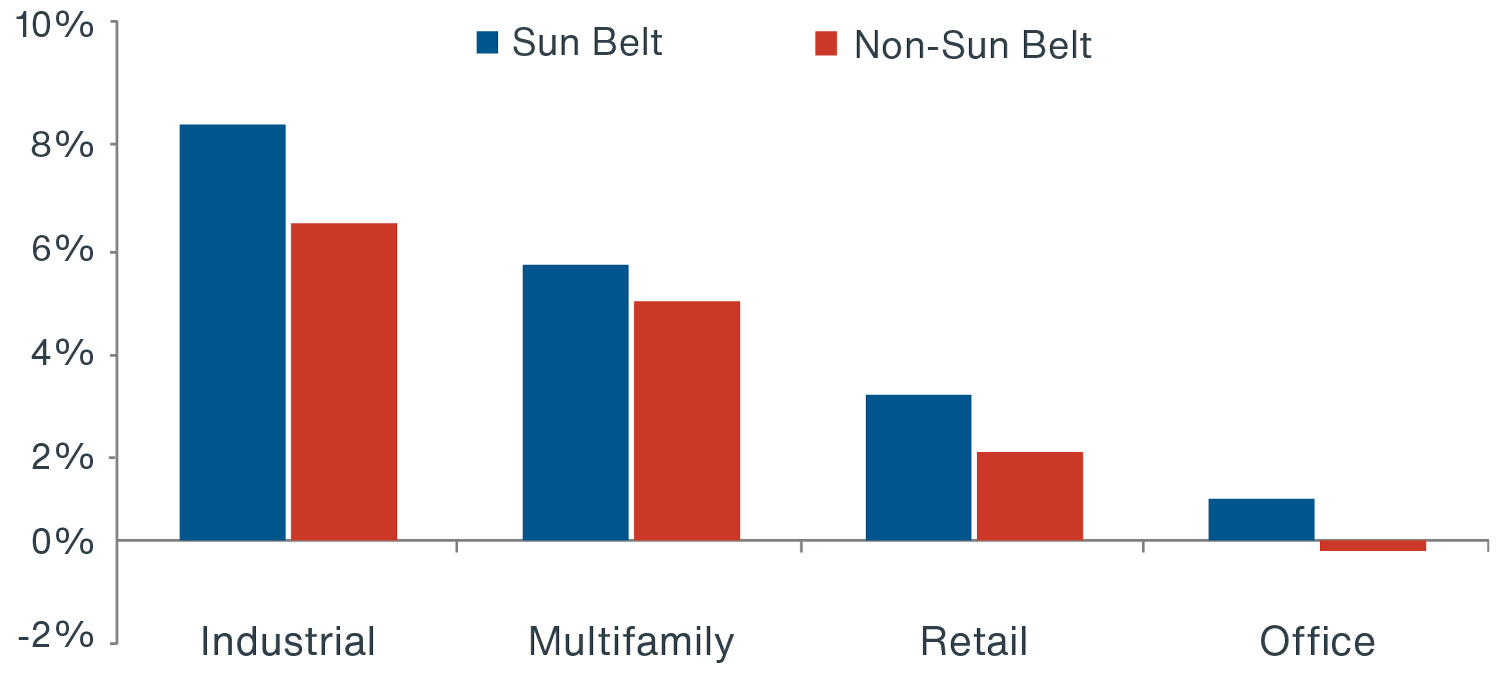
Source: Clarion Partners Investment Research, CBRE-EA, Q4 2023. Note: Based on the 26 largest Sun Belt markets tracked by CBRE-EA.
Office. Throughout the Sun Belt, the largest Class A office submarkets by square feet are San Francisco, Los Angeles, Atlanta, Dallas, and Orange County.17 California markets have a significant exposure to high-tech industries, which has been positive for economic growth statewide. Many top high-paying, office-using jobs are in corporate headquarters in premier suburbs.18 Looking forward, institutional investors should focus on irreplaceable assets near transit hubs, campuses, and commercial districts, which tend to be in more walkable, mixed-use settings due to the explosion in remote work and increasing office space efficiency.
Multifamily. Since Sun Belt markets report mixed homeownership rates, some with very high rates of owner-occupied units, we recommend targeting high-growth downtown areas for multifamily housing near younger employment hubs. Local barriers to entry (e.g. zoning and land-use restrictions) should be critically reviewed, as select metros may be at risk of oversupply.19 Single-and multifamily rentals in master-planned communities are likely be more common for larger households. Many millennials may opt for gated community living as they start or grow families. Much professionally managed and full-service rental housing will cater to the elderly constituency who prefer non-car-dependent, village-style living.
Retail. Urban and suburban shopping formats should target highstreet, grocery-anchored, and lifestyle centers with considerable population density and/or in wealthier neighborhoods. Proximity to top job and housing sub-markets is crucial. Also, seniors tend to have higher net worth’s and shop more in stores.
Industrial. Four out of six of the largest and most active distribution markets are in the region – Los Angeles, the Inland Empire, Dallas/Fort Worth, and Atlanta. The rapidly growing populations in the Southeast and Southwest, Panama Canal expansion, burgeoning recovery of manufacturing, and U.S. energy boom should all bode well for ongoing demand in the region.
Hotel. Tourism is an important all year-round business attracting millions of both domestic and international leisure and business travelers. Nationwide, foreign spending has also reached record levels. We are focused on high-quality, full-service hotels with top beaches, access to the great outdoors, food & beverage, corporate events, and meeting spaces.
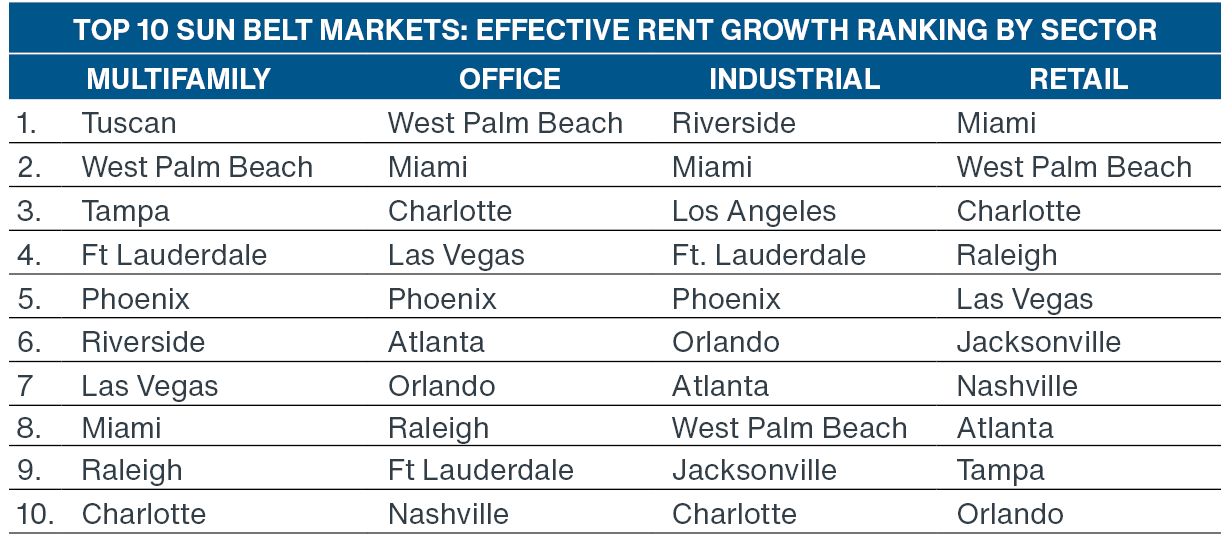
Source: CBRE-EA, Clarion Partners Investment Research, Q4 2023. Note: Based on the 26 largest markets tracked by CPRE-EA.
SUN BELT MARKETS HAVE CONSISTENTLY OUTPERFORMED THE NCREIF PROPERTY INDEX
The Sun Belt has seen a surge in population growth for decades from an influx of people seeking growing economic opportunity, a lower cost of living, and retirement in a warm and sunny climate. Clarion Partners believes that the investment outlook for the West and South is now especially attractive. The Sun Belt markets within the NCREIF Property Index (NPI) returns have performed extremely well over the past 20 years.
FIGURE 6: NCREIF RETURNS SIGNIFICANTLY OUTPERFORM THE OVERALL INDEX
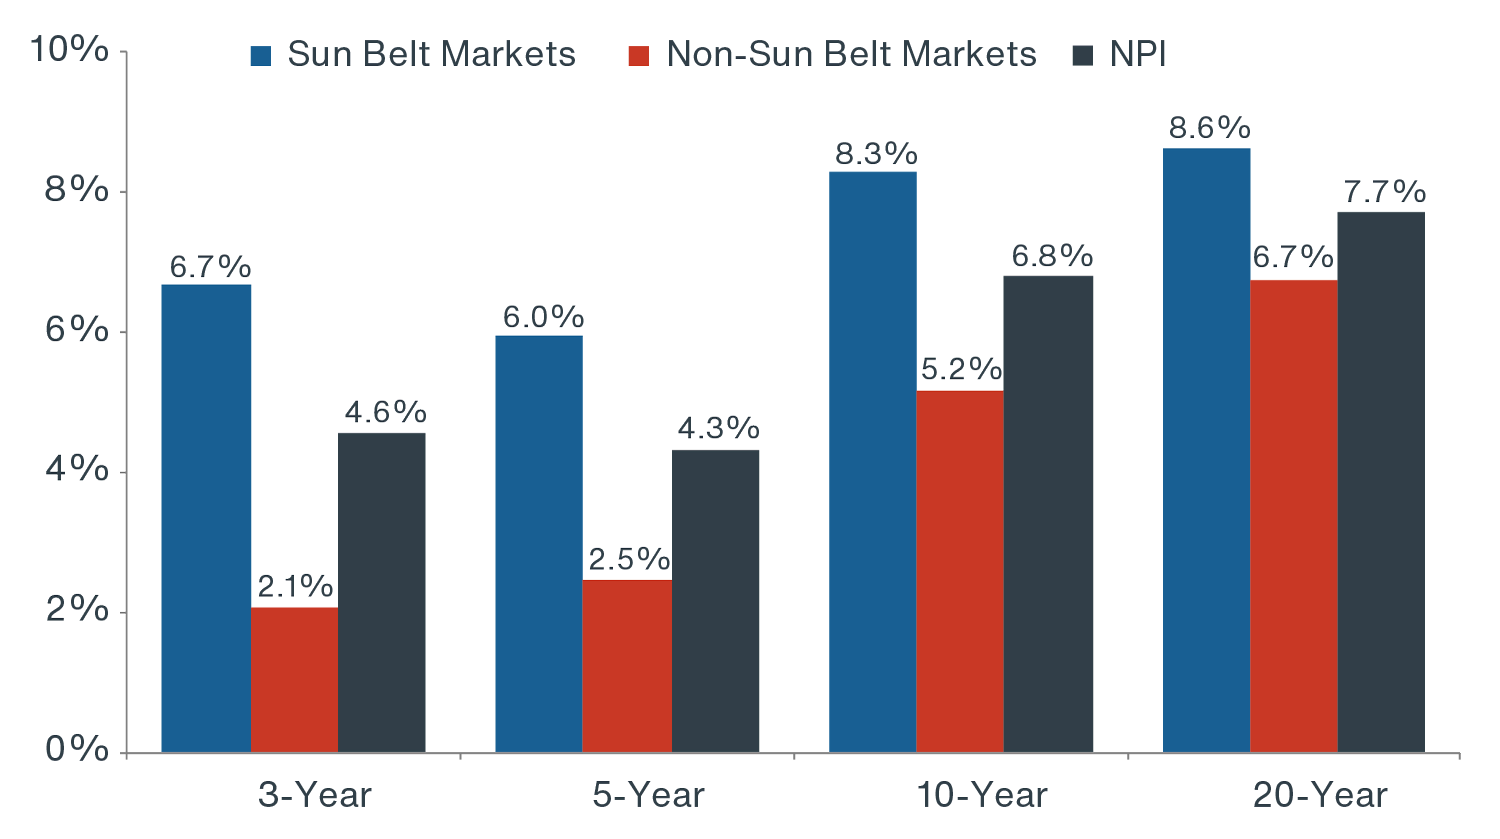 Source: NCREIF, Clarion Partners Investment Research, Q4 2023.
Through 2030, anticipated growth will be outsized in Texas and Florida. Many Sun Belt areas will become increasingly popular destinations for professionals, families, retirees, and world travelers.
Most importantly, the expanding new economy in the West and South may become increasingly dominant and will continue to attract top talent.
These dynamics should greatly improve and catalyze cultural, institutional, leisure, and intellectual property growth in urban areas, as well as household wealth, likely driving outsized commercial real estate appreciation.