Executive Summary
Retail investing has evolved considerably in the post-Covid era, reflecting changing consumer preferences and household needs.
Household spending has shifted from goods toward services, with health and wellness, fitness, personal care, dining, and childcare capturing a growing share of discretionary spending as more goods purchases move online.1,2
Hybrid work has reinforced this trend by shifting weekday activity toward residential neighborhoods, while consumers increasingly favor convenient, recurring visits over destination shopping.3 As a result, service-tenant concentrations offer an increasingly important indication of underlying trade-area demand, reflecting patterns of local visitation and consumer behavior that traditional anchor labels and demographic metrics may not fully capture.
The ability to use more relevant data, such as work-from-home concentration, to identify adjacent centers benefiting from the same demand tailwinds as premium-anchored centers can reveal pricing dislocations and create opportunities for enhanced investment returns.
MARKET PERCEPTION IS LAGGING FUNDAMENTALS
Institutional demand for open-air retail continues to strengthen, yet most investors continue to focus on grocery- or premium-anchored centers, even as
a notable portion
of consumer spending in the same trade areas occurs at adjacent, non-premium-anchored properties. This gap reflects a bias toward using conventional “anchor labels” as proxies for demand, which has not kept pace with the granularity or variety of data now available to underwrite retail and the changing trends it reflects.
For owners able to underwrite using dynamic data that captures emerging patterns in consumer and household behavior, there is an opportunity to acquire assets at going-in yields typically reserved for weaker locations while retaining exposure to the same demand drivers as comparable premium-anchored centers.
REDEFINING THE INVESTABLE UNIVERSE
An anchor label alone does not make a center investable. Some discount-anchored or under-merchandised centers are priced accordingly because the underlying trade areas genuinely cannot support stronger tenancy. Some centers are screened out at this stage because their trade-area fundamentals fail to meet our investment criteria. Conversely, premium-anchored centers in the same markets are often already priced for the demand they serve, leaving limited room for the kind of mispricing this strategy targets.
We believe the most attractive opportunities sit between these two extremes: centers where consumer and tenant behavior data indicate trade-area demand comparable to premium-anchored peers nearby.
In practice, this means layering data sources that most underwriters do not use: store-level sales and visitation data that show where spending is actually occurring, service tenant composition that reveals the discretionary habits of nearby households, and indicators such as work-from-home concentration, educational attainment, and household formation that capture how daytime population and spending power have shifted. Scored together, these inputs allow us to rank trade areas based on demonstrated behavior rather than static demographics, so that a center enters the investable universe because of what its surrounding households are doing, not because of the sign on its anchor box.
OUR MOUSETRAP: LEVERAGING PUMA-LEVEL DATA TO UNDERSTAND EVOLVING DEMAND
We apply this dynamic lens by screening the ~125 largest MSAs by population to identify the top-tier Public Use Microdata Areas (PUMAs) within each, then evaluating all open-air retail assets within those respective areas. These Census-defined geographic areas provide access to a wide range of demographic, economic, and employment data, allowing for more granular comparisons across markets and helping identify pockets of underlying demand that conventional retail metrics may overlook.4 The framework focuses on four market buckets (Gateway, Major Southern Metros, Large Secondary, and Tertiary), each requiring a tailored approach:
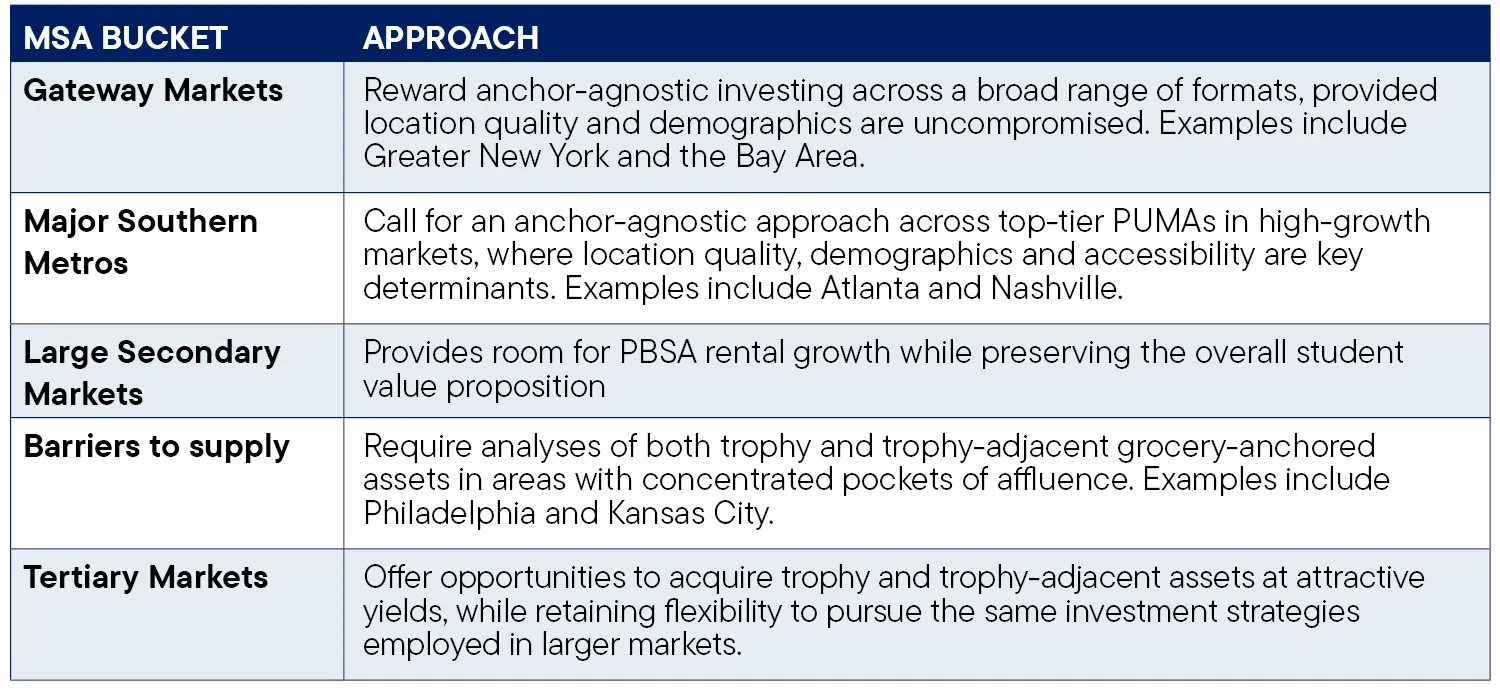
Importantly, identifying a high-scoring trade area is only the first step. Individual assets must then be evaluated to determine asset and tenant quality, in addition to whether pricing adequately reflects the underlying demand characteristics identified through the screening process.
SERVICE CONCEPTS AS A DEMAND PROXY
Household income, population growth, grocery location, and traffic counts are available to every institutional investor underwriting retail today. For that reason, they rarely identify emerging opportunities before the market has already fully priced them. While these metrics may describe a neighborhood’s potential, they do not describe all of what is happening.
The trade area's service-tenant composition offers a more current read. Concentrations of the following often indicate a trade area with underlying demand that may not be fully reflected in conventional market assessments:

Additionally, concentrations of coffee shops, smoothie bars, tax preparation services, and bank branches can signal consumer spending power, recurring visitation, and demand for convenience in ways that static demographic data cannot.5
On its own, however, service-tenant concentration is a demand signal, not an entire investment thesis. A center can exhibit strong service-tenant concentration and still be already fairly priced or reflect risks the underlying data does not capture, such as a weak anchor's near-term lease exposure.
FROM OBSERVATION TO REPEATABLE STRATEGY
Identifying one mispriced center is an opportunity; consistently identifying attractive trade areas and discerning which assets offer genuine pricing dislocations is a strategy. Our screening and underwriting process is designed to function as a repeatable discipline rather than a series of one-off observations. Each deal is sourced through the same multilayered framework: MSA selection, PUMA-level scoring, trade-area assessment, asset-level screening, and strategy-specific filtering.
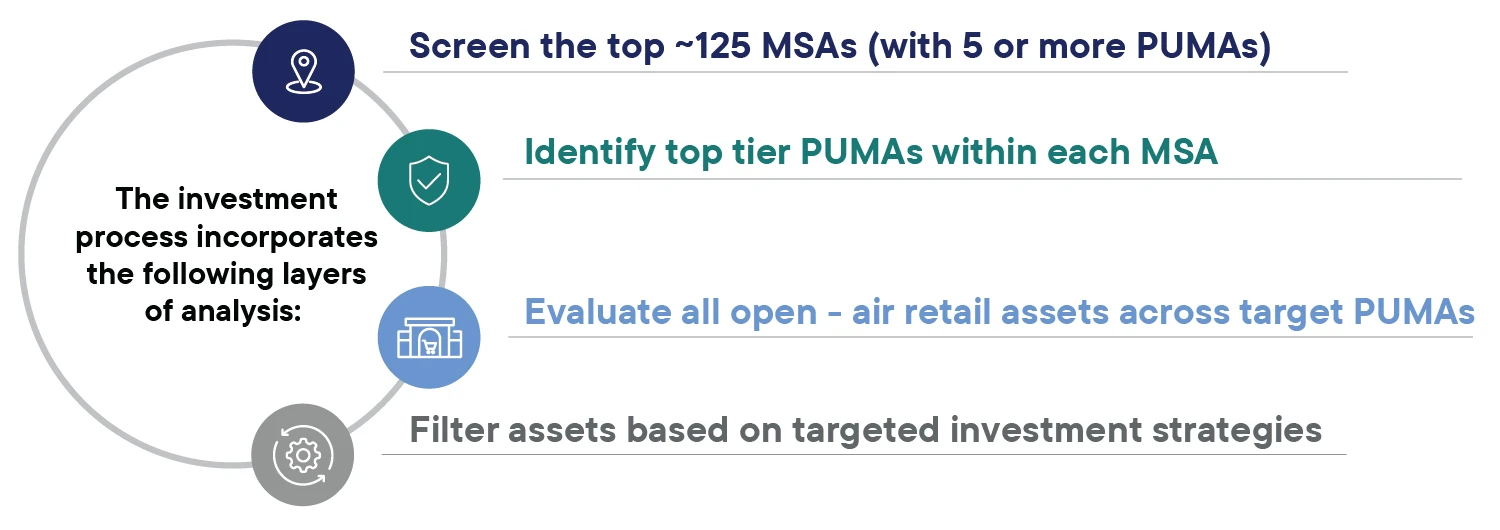
Asset-level underwriting:
Within target PUMAs, open-air retail assets are evaluated and filtered according to three investment strategies: discount-anchor dislocation, under-merchandising, and hidden mark-to-market.
Execution and repositioning: Once acquired, the investment thesis is realized through active merchandising, including re-tenanting toward the service concepts that the trade area already demonstrates demand for, rather than passively collecting in-place rents.
Applied consistently, this framework allows the strategy to scale across MSA buckets, from anchor-agnostic sourcing in Gateway markets to opportunities to acquire trophy and trophy-adjacent assets at attractive yields in Tertiary markets, without relying on market-specific intuition alone.
INVESTOR CONSIDERATIONS
Effectively managing the risks associated with this strategy requires disciplined underwriting and conventional due diligence, irrespective of a strong PUMA score or service-tenant signal.
1)
Anchor and tenant credit risk:
A center may benefit from strong underlying trade-area demand, but the financial health of its anchor tenant (and other major tenants) remains an important consideration. An underperforming anchor or tenant base could negatively affect the center's ability to attract and retain tenants, potentially undermining the investment thesis. Therefore, it is crucial to assess tenant durability, particularly when pursuing opportunities involving discount-anchored centers.
2)
Signal risk:
Low in-place rents or weak merchandising mixes do not automatically represent mispricing opportunities. In some cases, they accurately reflect a trade area that cannot support stronger tenancy. Distinguishing a true dislocation from an appropriately priced weak asset depends on the quality and timeliness of the underlying data.
3)
Execution risk:
The thesis depends on re-tenanting toward the service concepts the data suggests the trade area can support, requiring local leasing relationships and market knowledge that the underlying data cannot provide on its own. An under-merchandised center that cannot attract the replacement tenants its location implies will not realize the upside identified through the screening process.
These risks do not necessarily diminish the opportunity. Beyond the screening tool, determining whether a given dislocation can translate into realized returns depends on market selection, signal validation, and execution capability.
CONCLUSION: UNDERWRITE THE TRADE AREA, NOT THE ANCHOR
Capturing the opportunity rests on three disciplines established in this paper. First, redefine the investable universe through data: screening the ~125 largest MSAs by population to identify top-tier PUMAs and ranking trade areas based on demonstrated household behavior rather than static demographics. Second, read service-tenant concentration, including healthcare, fitness, personal care, and enrichment, as a real-time proxy for discretionary demand, while recognizing it as a signal rather than a thesis. Third, act where that signal diverges from pricing.
Executed consistently, this framework allows investors to acquire assets at going-in yields typically reserved for weaker locations while retaining the rent growth and tenant demand of premium-anchored peers. The risks, including anchor durability, signal quality, and leasing execution, are real. But they are underwriting risks rather than reasons to stay within conventional labels.