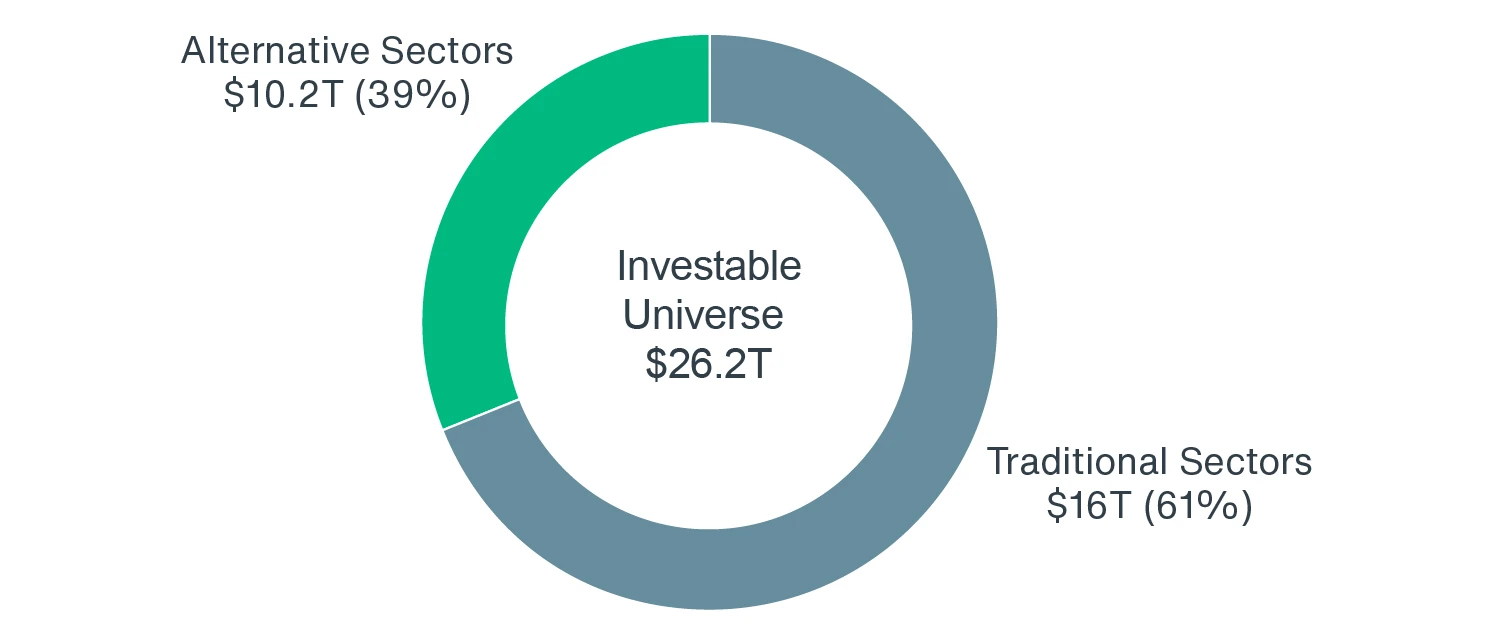
- Estimated $26.2T U.S. CRE investable Universe
- Institutional-quality represents $11.4T (43%)
- Residential sectors dominate
- Alternative sectors1 account for over 31.3% of Institutional Universe
- Rising investment in alternative sectors embodies evolving CRE Landscape
Source: Clarion Partners Global Research, RCG; As of H1 2025.
WHY MEASURE THE INVESTABLE UNIVERSE?
The goal of this analysis is to provide investors with a benchmark for the size and scale of the U.S. commercial real estate (CRE) market, individual property sectors, and the “institutional” quality portion of the market. Focusing exclusively on the United States, this report takes a bottom-up approach, aggregating estimates for the size of individual commercial real estate property types to arrive at a value for the overall commercial real estate market. This approach allows for segmentation between traditional and alternative property types, as well as the ability to estimate the share of “institutional” real estate by sector.
Just how big is the U.S. commercial real estate market? Although a seemingly straightforward question, estimating the size of the market is challenging for several reasons: lack of data and transparency (especially for smaller, less-liquid, and historically tracked property sectors), the widely diverse nature of the range of investible property types, and inconsistent industry definitions/classifications. This analysis attempts to answer the question through a two-step process: first, estimating the gross asset value of each property sector regardless of ownership, occupancy, tenure, size, location, and quality. After arriving at an estimate for the overall size of each sector, the second step is to apply filters based on assumptions for building class, vintage, size, and/or market to further narrow the investable universe to only include institutional assets – a subsegment of the investable universe that is limited to properties that fit the typical criteria of institutional investors.
Sector sizes are estimated using the most reliable private and public data sources for commercial real estate available, while also leveraging the knowledge and insights generated by Clarion Partners' and Rosen Consulting Group (RCG)’s experience in the market. For most sectors, the approach to calculating the overall value involves estimating the physical size of the sector, be it square footage, units, rooms, or beds; and combining this with an estimated value based on recent transaction data. Less historically tracked property sectors require more assumptions to estimate values due to the relative scarcity of reliable, market-level data, and still-fluid industry definitions. For property sectors where square footage or unit counts were not available, total value was estimated using information from third-party data sources or insights from market participants.
Estimating the investment universe is a useful exercise for CRE investors for several reasons. The estimated values in this report should aid investors in:
- Assessing the size and depth of individual property sectors
- Quantifying the opportunity to scale within emergent asset classes
- Allocating capital based on risk tolerance, market conditions, and investment objectives
- Tailoring portfolios according to specific investor goals and time horizons
- Managing risk by enhancing diversification
- Measuring relative performance
- Mapping and preparing for future growth opportunities
- Identifying opportunities for increased returns
ESTIMATING THE SIZE OF THE INVESTABLE COMMERCIAL REAL ESTATE UNIVERSE
As of mid-year 2025, the total size of the U.S. CRE investable universe is estimated to be $26.2 trillion (Figure 3). This total is further filtered to generate an estimate for the size of the institutional-quality segment of the investable universe. Filtering this total using a meticulous series of assumptions for building location, quality, age, and size, the total size of the “institutional” universe is estimated to be $11.4 trillion.
WHILE TRADITIONAL PROPERTY SECTORS MAINTAIN A DOMINANT SHARE, ALTERNATIVES ARE A SIGNIFICANT AND RISING COMPONENT
“Traditional” property sectors, which include industrial, multifamily, office, retail, and hotels are valued at $15.9 trillion, accounting for 61% of the investable market. Of this total, 49%, or $7.8 trillion, is estimated to be of institutional quality. Within the $11.4 trillion institutional universe, traditional sectors account for roughly 69% of the total (Figure 1). With a value of $2.6 trillion, apartments are the largest traditional sector, accounting for more than one-fifth of the institutional universe (Figure 2).
“Alternative” sectors, which include property types that have historically not been the predominant focus of institutional investors, account for the remaining 39% ($10.2 trillion) of the investable universe and $3.6 trillion, or 31%, of the institutional universe. The alternative subsegment of the CRE universe includes single-family rentals, student housing, age-restricted housing, manufactured housing, self-storage, life sciences, medical office, senior housing, data centers, industrial outdoor storage, and cold storage. Many listed REITs have been long-time players in the alternative sectors, but non-REIT investment has historically been limited. However, alternatives are an increasing share of institutional-investor portfolios.
FIGURE 1: INSTITUTIONAL UNIVERSE
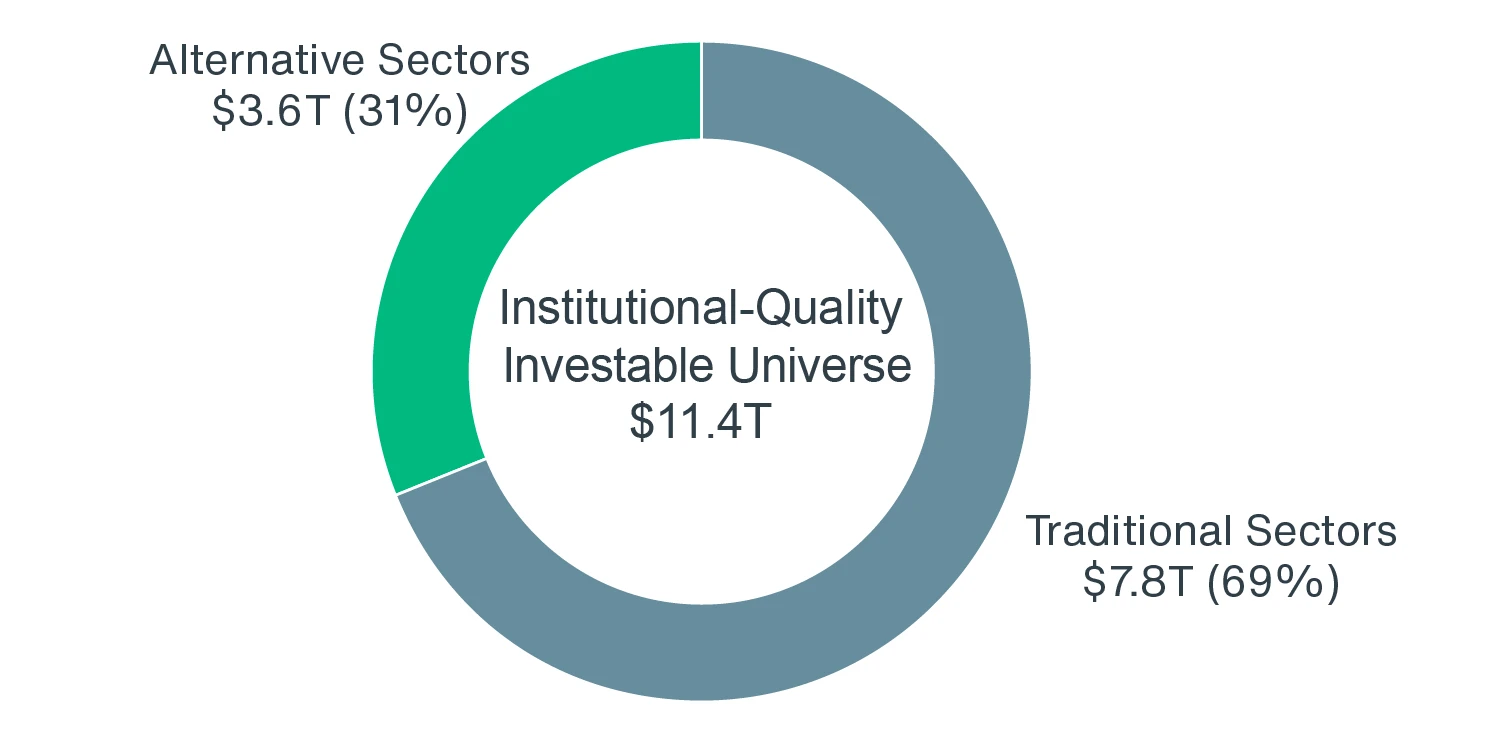
Source: Clarion Partners Global Research, RCG; As of H1 2025.
FIGURE 2: INSTITUTIONAL UNIVERSE BY SECTOR
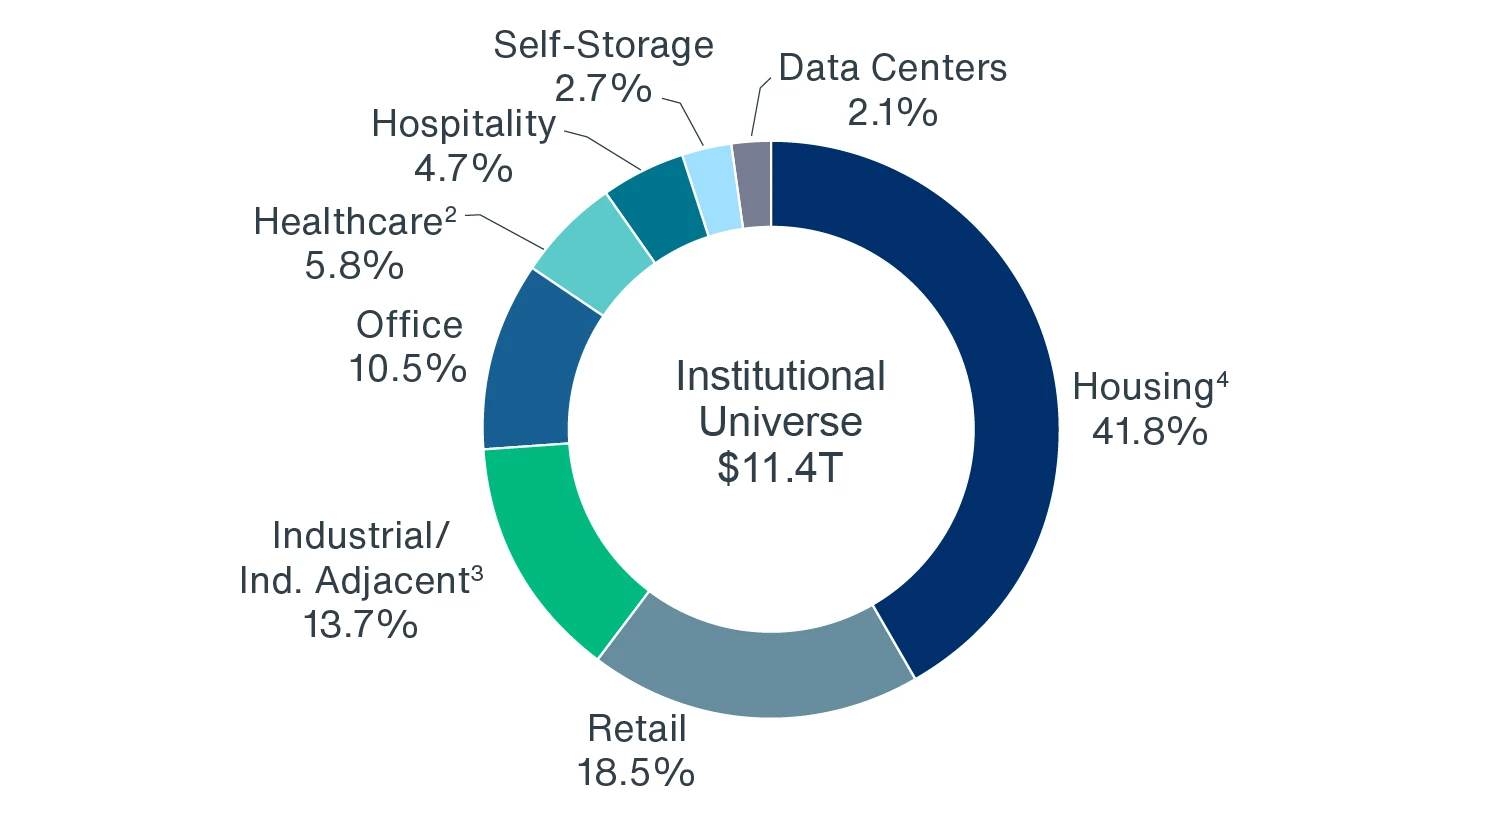
Source: Clarion Partners Global Research, RCG; As of H1 2025.
There are three identifiable groupings within the alternatives subset of the institutional market:
RESIDENTIAL SECTOR
The residential alternatives grouping (inclusive of scattered-site single-family rentals, build-to-rent, student housing, age-restricted housing, and manufactured housing) is valued at $2.1 trillion, or 18.9% of the institutional universe. Within this group, the scattered-site, single-family rental sector (with 3.9 million houses) has the largest estimated value ($1.4 trillion), accounting for 12.3% of the institutional universe. The student housing sector is the next largest housing sector within the group, comprised of 2.4 million beds with a valuation of $287 billion, followed by age-restricted housing at $229 billion and manufactured housing at $171 billion. Combining the residential alternatives grouping with traditional apartments results in the combined valuation of $4.8 trillion, making housing in a broader sense account for the lion’s share (41.8%) of the institutional universe.
INDUSTRIAL-ADJACENT SECTORS
Comprised of industrial outdoor storage (IOS) and cold storage warehousing, the industrial-adjacent group is valued at $199B, amounting to 1.8% of the institutional universe. Combining this group with the traditional industrial market results in a value of $1.6 trillion, or 13.7%, of the institutional universe.
HEALTHCARE SECTOR
The healthcare property types: life sciences, medical office, and senior housing & skilled nursing facilities have a combined estimated institutional value of $664 billion, equating to 5.8% of the institutional universe. With a value of $390 billion, medical office accounts for more than half of the value of the combined healthcare sector, followed by senior housing & skilled nursing ($187 billion) and life sciences ($86 billion).
FIGURE 3: COMMERCIAL REAL ESTATE INVESTABLE AND INSTITUTIONAL UNIVERSE
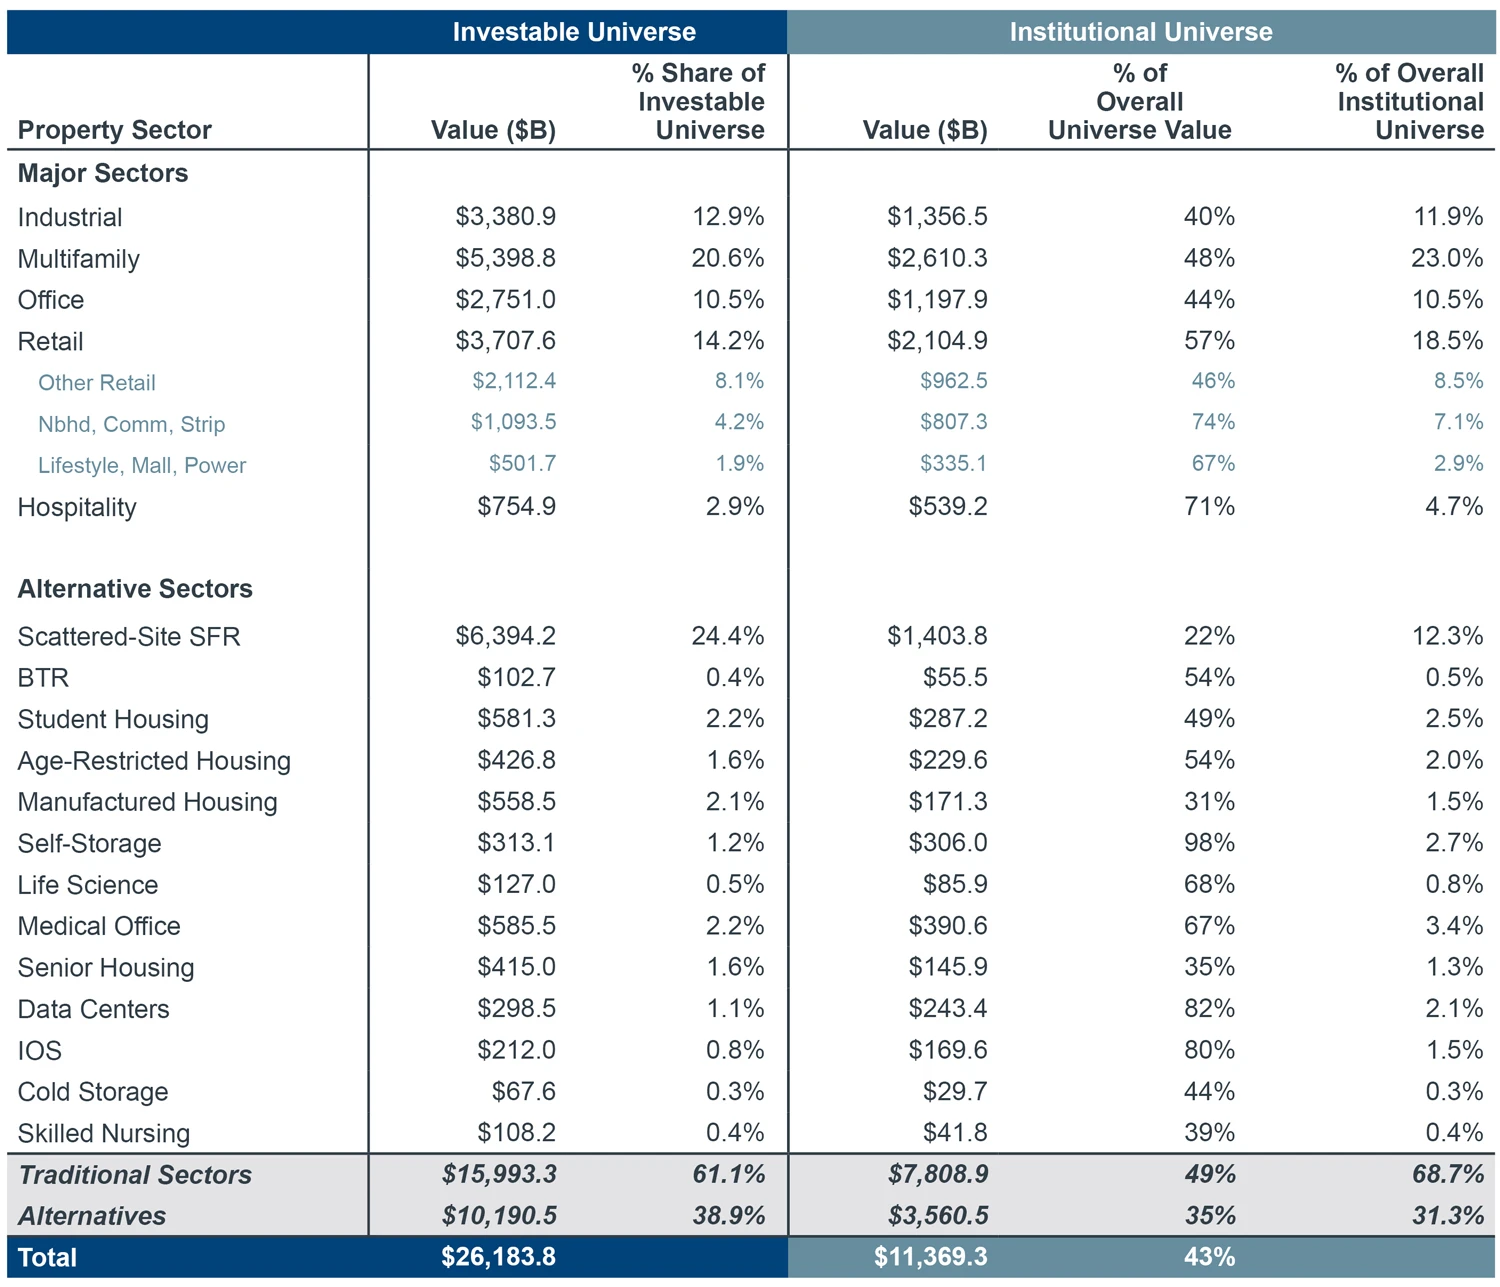
Source: Census, BLS, Moody’s Analytics, USDA, National Association of Realtors, U.S. Energy Information Administration, NICMAP, RevistaMed, Lodging Econometrics, Yardi Matrix, Greenstreet, Marcus & Millichap, CBRE-EA, CBRE, JLL, Joint Center for Housing Studies of Harvard University, MSCI Real Capital Analytics, Rosen Consulting Group, Clarion Partners Global Research. As of H1 2025.