U.S. INDUSTRIAL OUTLOOK BRIGHT
U.S. industrial property has continued to be the best- performing commercial real estate (CRE) sector amidst historically robust demand. Institutional-quality industrial investments have significantly outpaced the overall NCREIF property Index (NPI) index since 2011, as well as the other core CRE property types over recent years. The enduring strength of the sector has been extraordinary, driven in strong part by the ongoing rise in U.S. consumer spending, omnichannel expansion, and expanding global trade.
Clarion Partners’ short- and long-term outlook for the sector is positive given structural transformations in both global supply chains and last-mile distribution.
Over the next few years, we believe that three main factors will drive greater industrial space requirements and higher rents: 1) supply chain disruption and inventory rebuilding, 2) the continued e-commerce boom, and 3) higher construction and replacement costs.
STRONGEST PROPERTY FUNDAMENTALS ON RECORD
Nationwide, U.S. industrial property fundamentals are the strongest on record, with all-time low vacancy and soaring rents. New leasing activity has been historically high and nearly half of product under construction has been pre-leased.1 These high-demand conditions have created a market where landlords have a greater ability to increase rents at warehouse and distribution properties in most markets.
-
Vacancy at All-Time Low. As of Q3 2021, U.S. industrial vacancy reached a record low of 3.6%. All top distribution hubs report vacancy levels well below long-term averages
(Figure 1).2
-
Robust Rent Growth. Recently, rent growth also reached the highest pace in over two decades. Average asking rents rose by 10.4%, while same-store asking rents were up 4.5%, year-over-year as of Q3 2021.3
-
Demand Outpacing New Supply. Over the last several years, net absorption has continued to outpace new supply, which shows little sign of slowing down. Year-to-date, 292 million sf was absorbed, well-above the 193 million sf of new supply, and net absorption reached the second highest level on record in Q3.
FIGURE 1: SELECT INDUSTRIAL HUBS’ VACANCY RATES - Q3 2021 VS. LTA
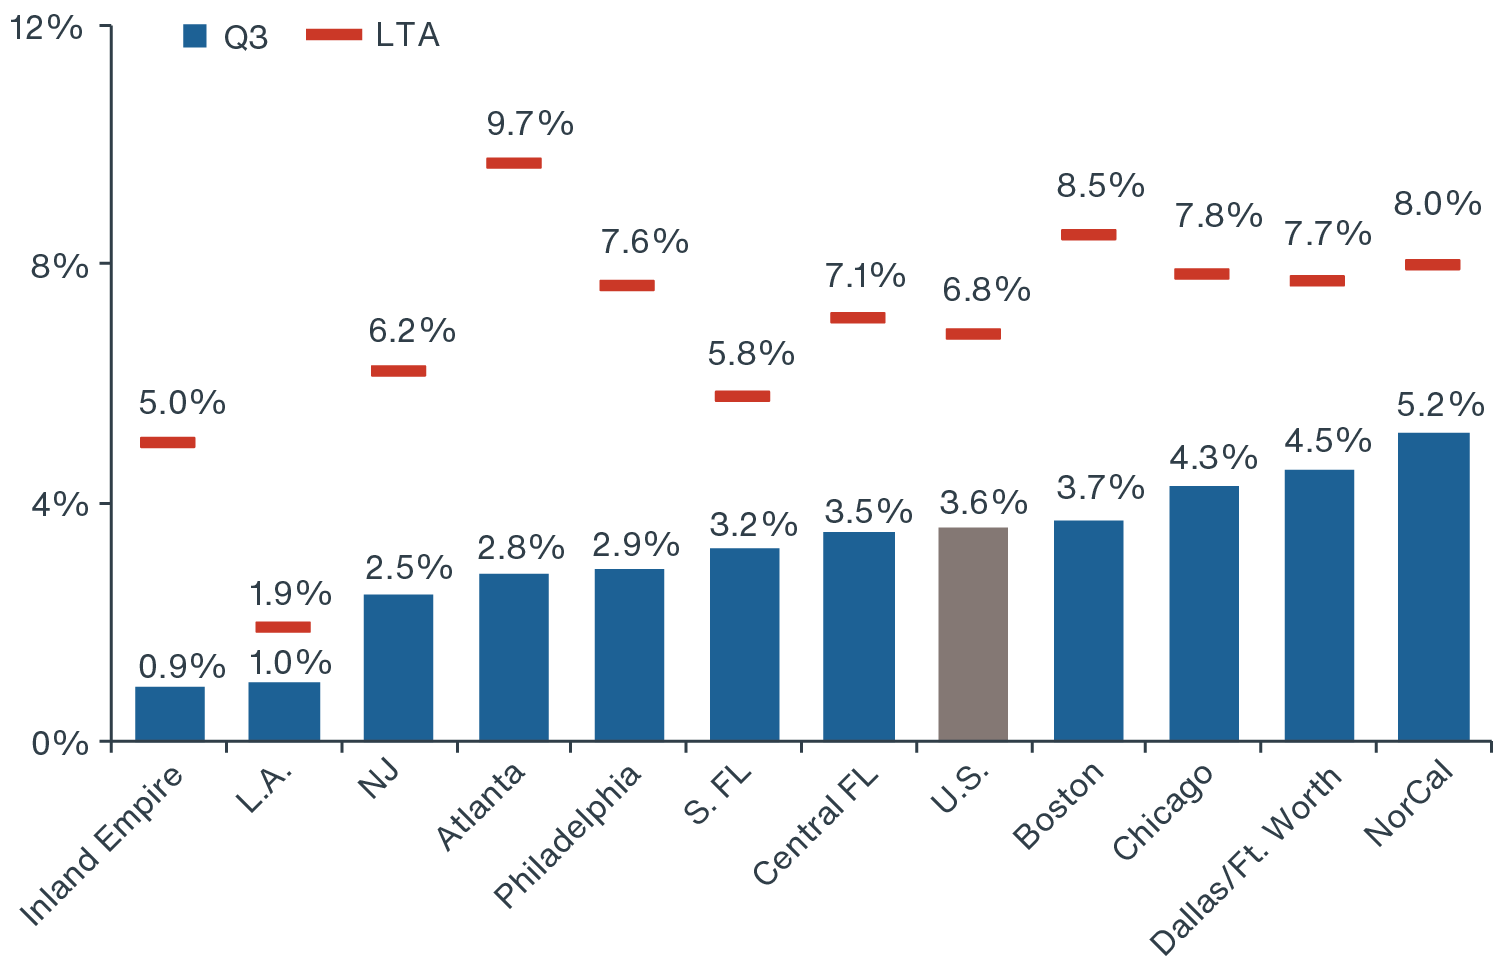
Source: CBRE-EA, Clarion Partners Investment Research, Q3 2021. Note: LTA = long-term average: Q2 2002 - Q3 2021.
SUPPLY CHAIN DISRUPTION & INVENTORY REBUILDING HEIGHTEN DEMAND
The onset of the global COVID-19 pandemic precipitated a rapid and unprecedented demand shock that interrupted normal business conditions. Many suppliers quickly scaled back production, which led to widespread inventory shortages and distribution delays. A synchronized global economic recovery, or demand comeback, is now well underway, which has put pressure on the existing supply chain infrastructure. U.S. retail sales are now 20% above pre-COVID levels, and the inventory- to-sales ratio has fallen to an all-time low. Demand for U.S. logistics property has well outpaced existing supply conditions. The situation is particularly pronounced near major population centers and large coastal ports receiving intercontinental freight shipments. Southern California and New York/New Jersey are especially underserved.4
This supply chain disruption has led more and more logistics occupiers to adopt a “just-in-case” management strategy, often referred to as inventory rebuilding. This both 1) hedges against potential future disruptions and 2) ensures timely last-mile fulfillment. Clarion Partners expects U.S. business inventories to rise swiftly in the years ahead
(Figure 2).5 It has been estimated that a 1% rise in inventories is consistent with approximately 100 million sf of net absorption; therefore, a 5% increase in U.S. business inventory levels would require an additional 400 to 500 million sf of warehouse space.6
FIGURE 2: SURGE IN U.S. RETAIL SALES TO DRIVE BUSINESS INVENTORIES HIGHER
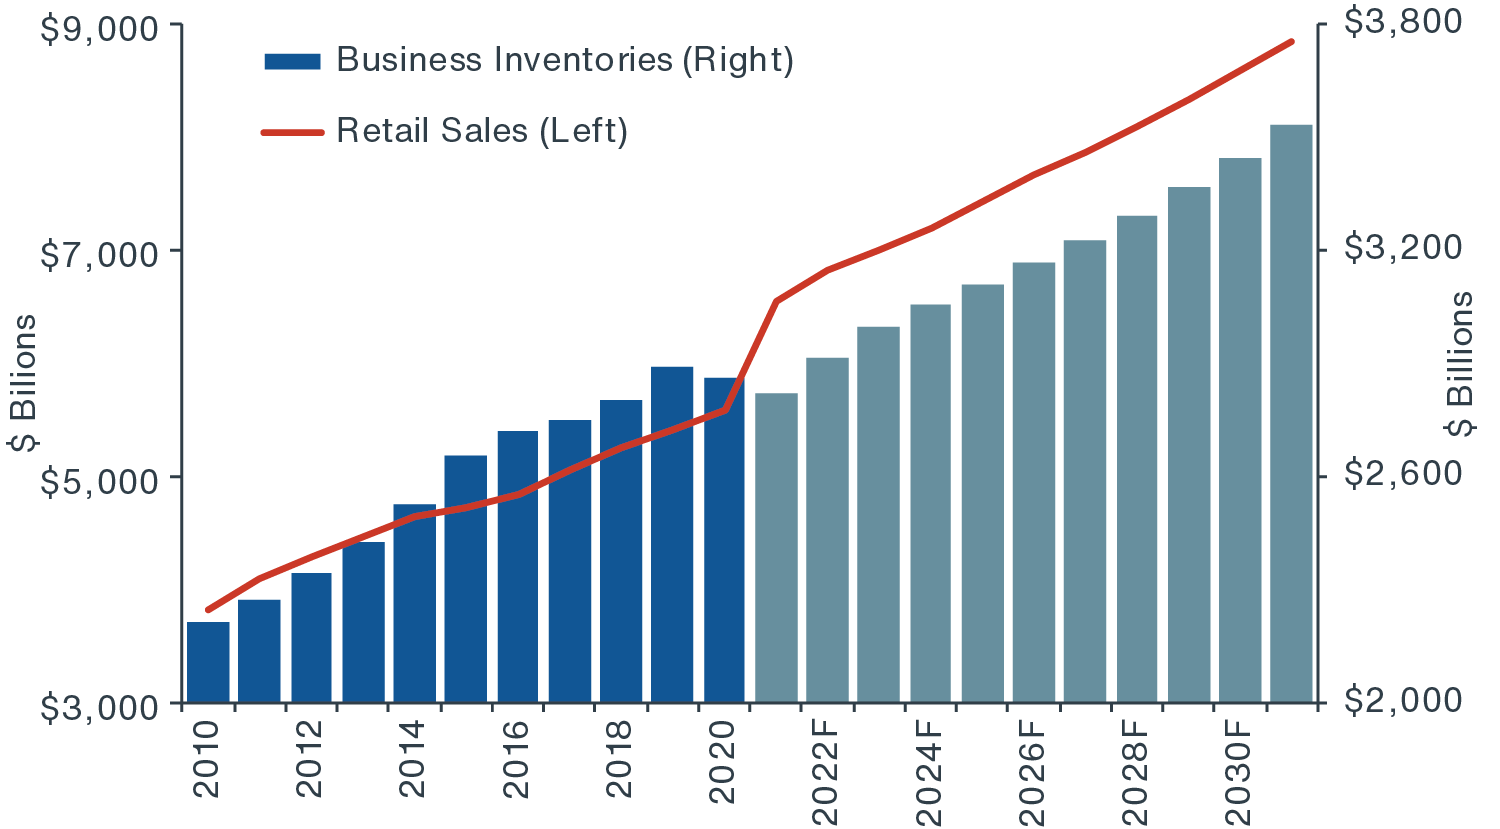
Source: Moody’s Analytics, Clarion Partners Investment Research, Q3 2021.
STRONG MOMENTUM IN E-COMMERCE SALES BOOM
The ongoing expansion of e-commerce logistics is by far the largest secular tailwind for industrial demand. E-commerce users typically utilize three times more warehouse space than traditional retailers, augmenting the demand for warehouse and distribution space. The COVID-19 pandemic dramatically accelerated the recent pace of e-commerce sales; annual growth accelerated to 40% in 2020, the highest pace on record and a sizable increase from the 15% pace over recent years.7 Online sales now account for about 20% of total core retail sales (as of mid-2021), which could grow to about 30% in the U.S. by 2030
(Figure 3).8
FIGURE 3: U.S. E-COMMERCE SALES AS A SHARE OF CORE RETAIL SALES
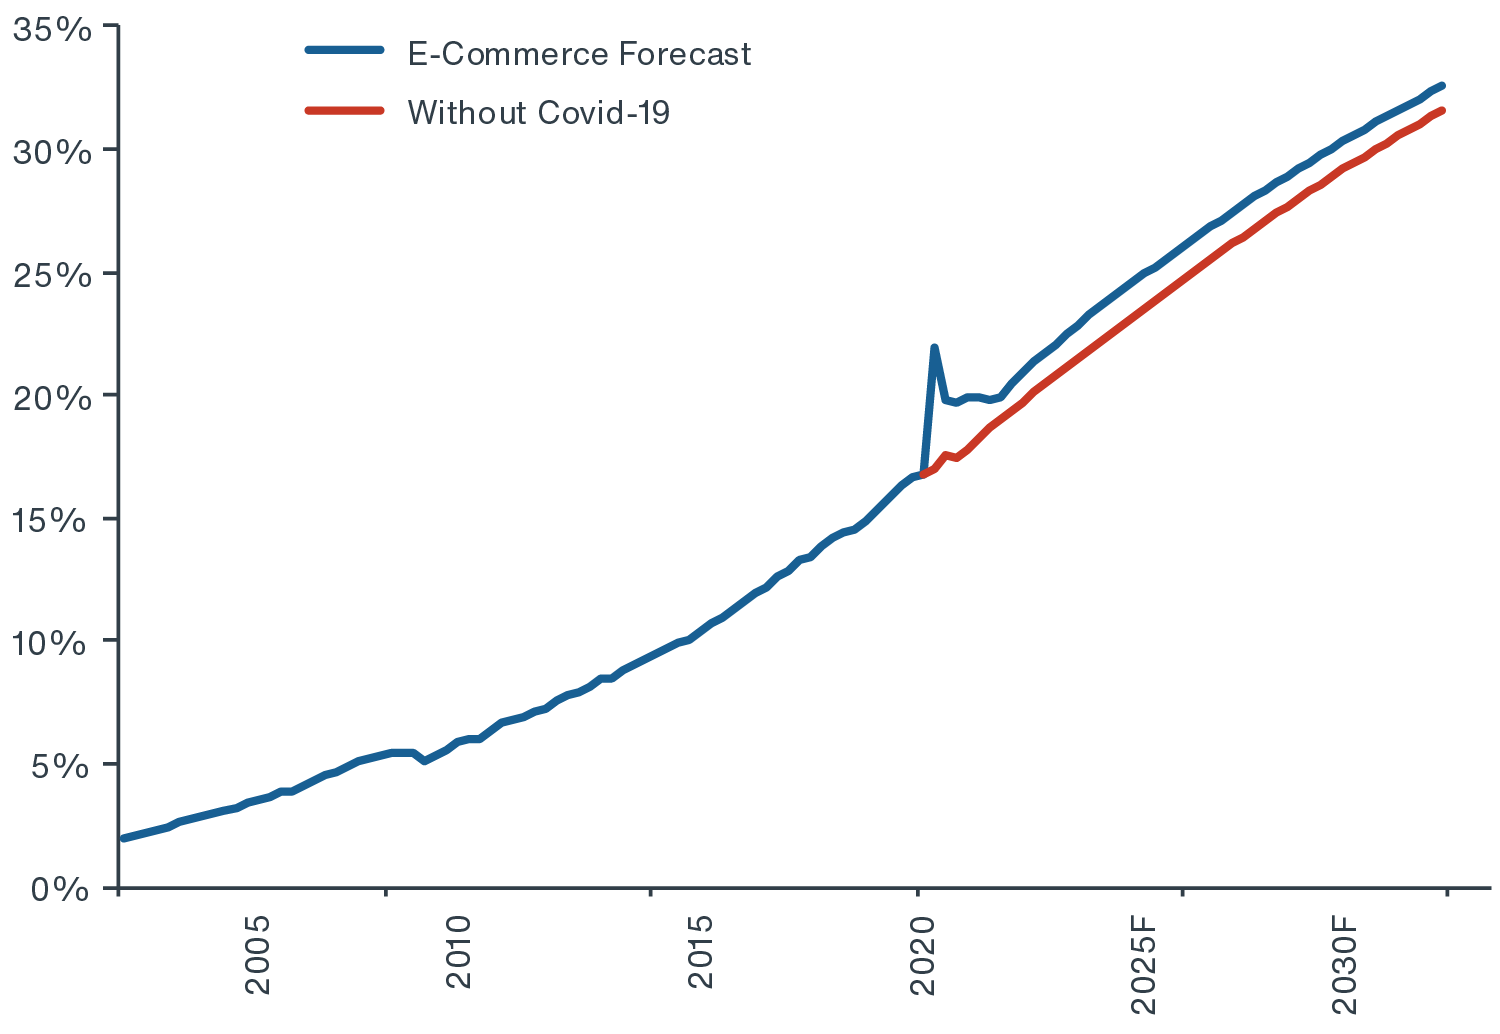
Source: CBRE, Moody’s Analytics, Clarion Partners Investment Research, Q3 2021.11
By 2026, total U.S. e-commerce sales are forecast to exceed $1.0 trillion, double the $500 billion just three years ago in 2018
(Figure 4).9 Industry estimates indicate that every $1 billion of new e-commerce sales growth requires 1.0 million sf of additional warehouse space. Consequently, an estimated 340 million sf of new space will be needed over the next five years to accommodate e-commerce expansion alone, including as much as 120 million sf of new space to handle returns.10
As e-fulfillment becomes more dominant, minimizing delivery time and costs will continue to be essential. We expect that there will continue to be attractive investment opportunities ahead in the last-mile segment based on recent demand growth trends.
- Surging Absorption Levels for Light-Industrial. Absorption of light-industrial space, which are less than 400,000 sf and largely made up of regional and last-mile users, increased by almost 10% in the 10 largest U.S. metro areas since 2016 compared to the trailing comparable period. Within this segment, Q3 2021 set records for highest quarterly net absorption and lowest availability.12
- E-Commerce Giants Pay Premium for Last-Mile. Recent data shows that the most competitive occupiers, such as Amazon, FedEx, and UPS, will pay a high cost to be near end consumers amidst escalating delivery costs, which have been exacerbated by limited land availability. At the same time, many big-box retailers’ omni-channel operations have grown rapidly over the past few years, including Walmart, Wayfair, Home Depot, Costco, Lowe’s, Target, and Kroger. Consequently, competition for available space has intensified, pushing rents higher.
HIGHER REPLACEMENT COSTS LIKELY TO HINDER NEW SUPPLY & BOOST RENT GROWTH
Over the past year and a half, there has been an unprecedented surge in U.S. construction costs. Nationwide, building material prices increased at the fastest pace in a decade. Subsequently, CRE development and renovation costs have risen significantly. As of Q3 2021, overall building costs remained elevated, up by approximately 35% from early 2020.13 On a year-over-year basis, construction labor costs were up by 5.3% and industrial land costs in East and West Coast markets were up by 50% to 75%, respectively.14
Higher construction costs will negatively impact project timelines and budgets for the 1.4 billion sf of warehouse space planned over the next 5 years.15 However, Clarion Partners believes that developers have the ability to pass on higher costs to future tenants in the form of higher rents given the robust demand conditions.
There are still attractive development opportunities amidst a shortage of high-quality modern warehouse space in desired locations. Much of U.S. existing stock is dated and does not well serve the demands of modern-day omnichannel distribution.
-
Shortage of Class A Inventory. Class A warehouse and distribution property still remains a relatively low share of overall U.S. industrial inventory at 15%, about 2.2 billion sf of the total 15 billion sf nationwide.
-
Widespread Functional Obsolescence. About 75% of total U.S. industrial inventory was built before 2000.16 Over the next five years, a significant portion of existing warehouse stock will surpass the obsolescence threshold and offer a sizeable development and redevelopment opportunity.
Clarion Partners anticipates that tenant demand for industrial property – in particular, modern Class A facilities – will be so strong, amidst limited new supply, that landlords will be able to sustain and escalate rent levels. A manageable level of new completions will also benefit market supply and demand fundamentals. We expect effective rent growth levels to range between 5.1% and 6.6% from 2021 to 2023
(Figure 5). Many logistics tenants will be required to pay a premium for high- quality facilities in top locations.
FIGURE 5: INDUSTRIAL EFFECTIVE RENT GROWTH - HISTORY & FORECAST
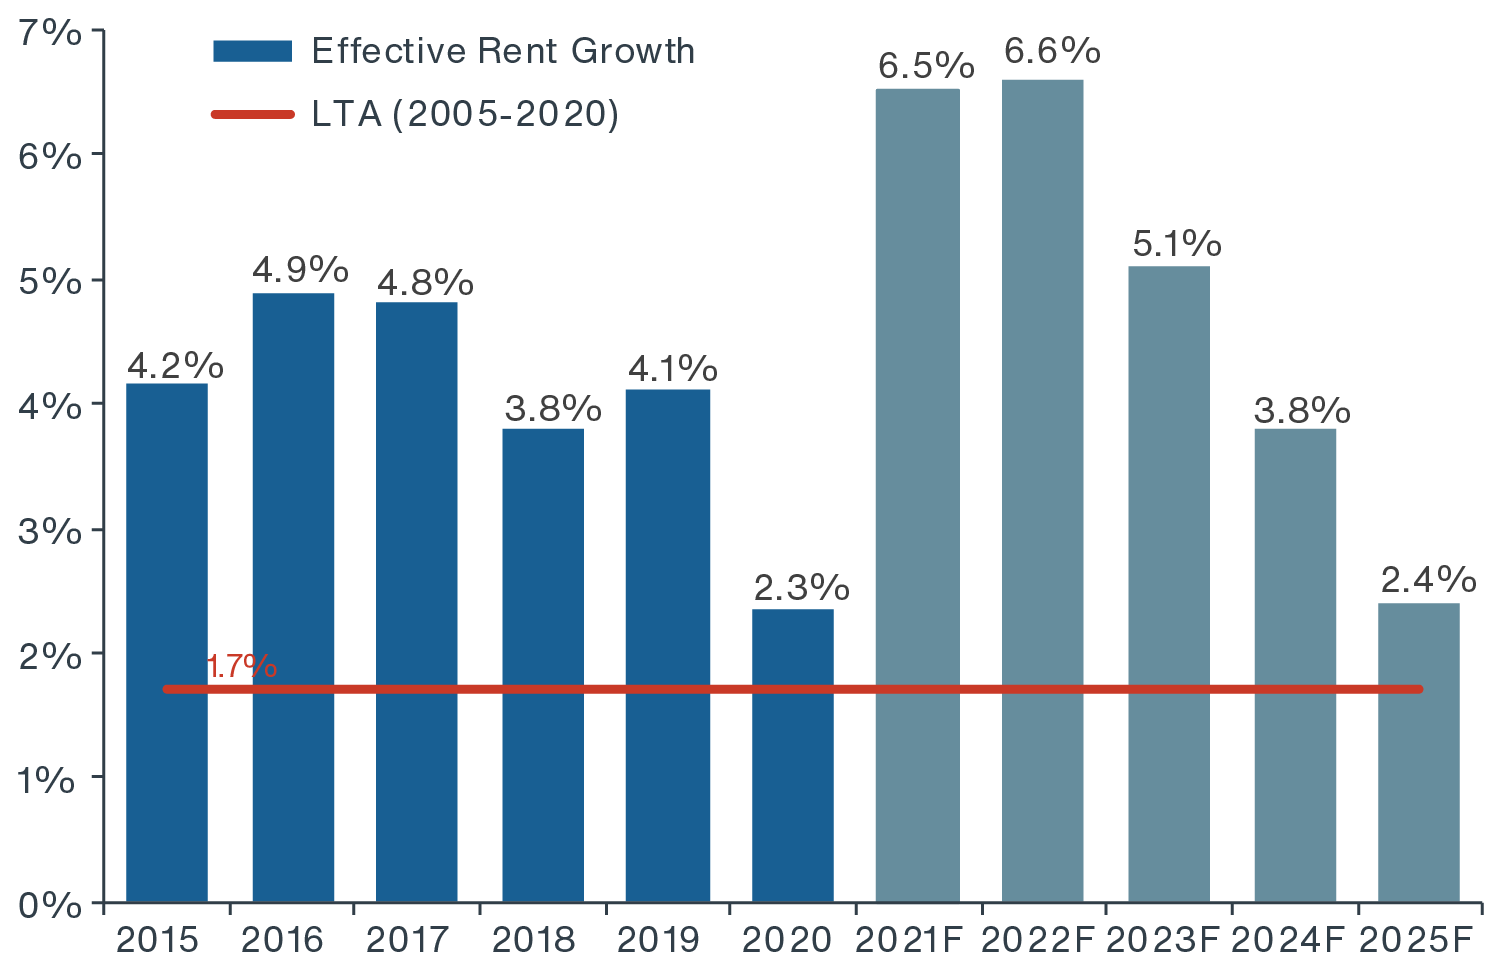
Source: CBRE-EA, Clarion Partners Investment Research, Q4 2021. Note: Forecast from 2021 to 2025 was provided by Clarion Partners Investment Research as of October 2021.
INVESTOR ALLOCATIONS TO INDUSTRIAL ON THE RISE
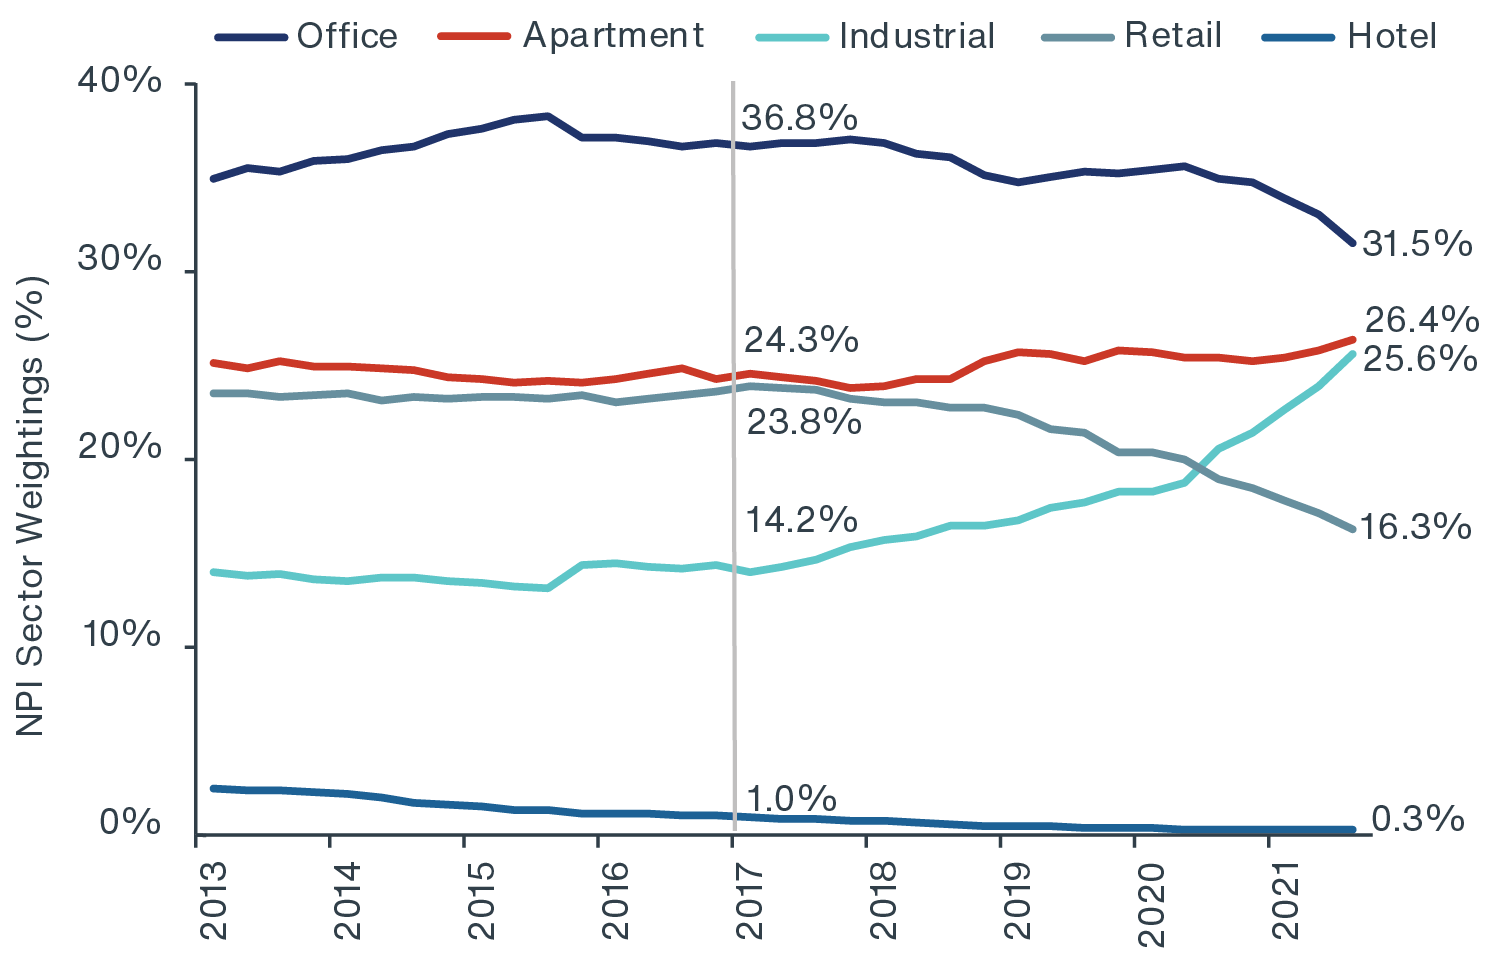
Investor interest in U.S. industrial assets has continued to escalate. Consequently, NPI portfolio allocations to the sector have swiftly risen from about 14.2% in 2017 to 25.6% in 2021
(Figure 6). Looking ahead, the more recent phenomena of inventory rebuilding and higher replacement costs will continue to drive growth within the logistics industry, along with the ongoing e-commerce boom. Clarion Partners is optimistic about the near- and long-term appreciation and income growth potential for well-located, high-quality industrial investments amidst the ongoing strength of consumer spending and rise in global trade. Thus, the outperformance of the industrial sector will likely continue over the next few years.
FIGURE 6: NCREIF INDUSTRIAL ALLOCATION CONTINUE TO SURGE
Source: NCREIF, Clarion Partners Investment Research, Q3 2021.